Research · Cycle Sequencing & Phases
Builders Just Flipped the Housing Signal

Housing Price Inversion and the Return of Price Discovery
For the first time in modern housing data, the median price of new construction homes has fallen below the median price of existing homes. Historically, new homes carried a structural premium. That premium has now inverted.
Within Our Strategy’s phase-sequenced framework, this is a mechanism shift rather than a narrative event. Builders respond to cash flow constraints and adjust price. Existing homeowners respond to anchoring and resist adjustment. When those behaviors diverge, equilibrium typically migrates toward the actor under greater balance sheet pressure.
Phase Mapping
Current Alignment: Late Phase One with Phase Two Pressure
Phase One is defined by surface stability masking internal cracks. Housing now exhibits:
Source: BuildersLens.com Signal Framework | Data as of March 08, 2026
- Material builder price reductions from the twenty twenty-two peak
- Stabilizing builder sales after incentive escalation
- Existing home transaction volumes near multi-decade lows
- Widening buy-versus-rent spreads in multiple regions
This divergence indicates that price discovery has restarted, but unevenly.
Transmission Channels
Inventory and Lot Control
Large public builders control hundreds of thousands of lots through ownership and option agreements. Elevated inventory, especially in the South, increases forward pricing sensitivity.
Credit Channel
Mortgage rate buydowns function as embedded price reductions. If Federal Housing Administration delinquency rates rise or private credit tightens, incentive intensity may increase.
Labor Linkage
Housing becomes systemically destabilizing only if labor deterioration accelerates. Hiring rate weakness and rising continuing claims would amplify downside pressure.
Probability Timeline Bands
Through June 2026: Approximately sixty percent probability of continued slow, regionally dispersed adjustment.
Into December 2026: Approximately thirty percent probability that existing home prices converge downward in builder-heavy markets.
Into June 2027: Approximately ten percent probability of stabilization without broad clearing, contingent on labor reacceleration and mortgage rate easing.
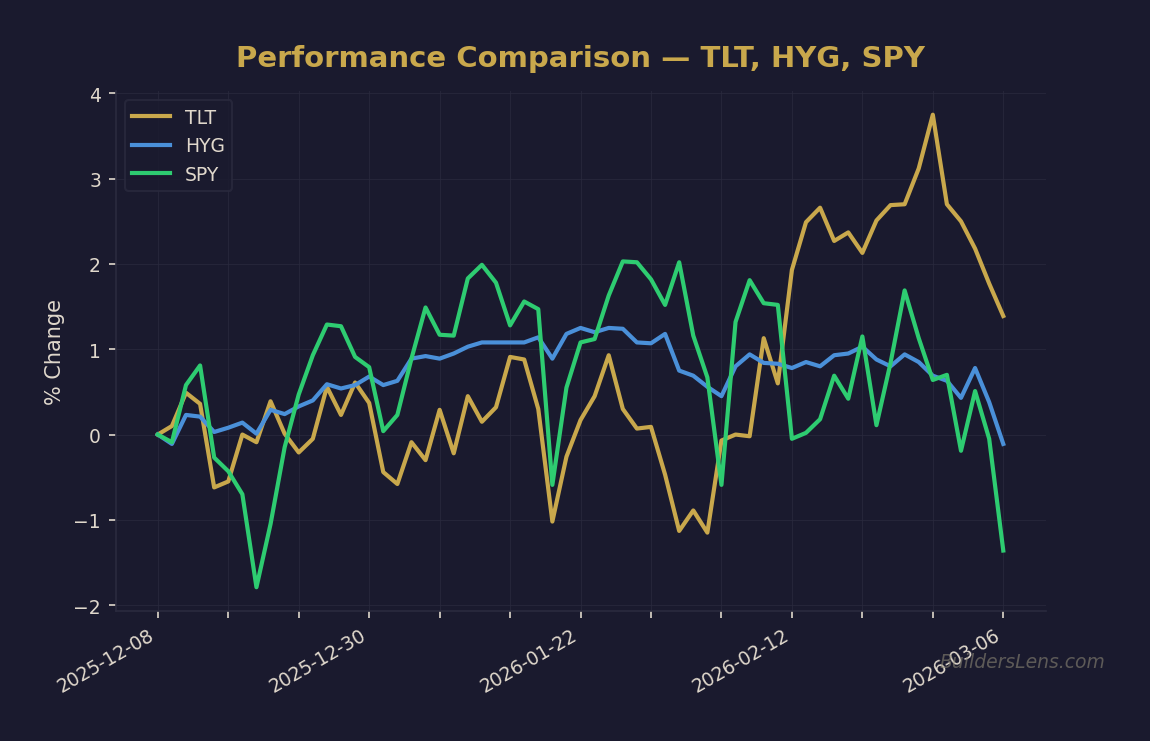
Multi-Asset Monitoring
- Rates: Ten-year Treasury yield direction and mortgage spreads
- Credit: High yield spreads and lending standards
- Liquidity: Repo stability and Treasury auction demand
- Labor: Hiring rate and continuing claims
- Housing Internals: Inventory, days on market, incentive escalation
Invalidation Conditions
- Sustained labor reacceleration
- Mortgage rate compression without margin stress
- Inventory contraction without price concessions
Conclusion
The inversion between new and existing home prices reflects a structural restart in price discovery. Builders have adjusted first. The question is whether existing sellers follow voluntarily or are compelled by broader macro forces.
Our Strategy remains probability-weighted and confirmation-driven. Housing is now a live pressure indicator within the broader macro regime.
Get the Daily Phase Brief
Signal changes, data releases to watch, and today’s regime assessment — delivered every morning before market open.
Join investors tracking the macro cycle. Unsubscribe anytime.
📊 Run Your Own Analysis
Use the BuildersLens 65-Signal Analyzer to see live macro positioning for tickers mentioned in this article:
→ Analyze TLT (Long-Term Treasuries)
→ Analyze HYG (High Yield Credit)
📊 Run Your Own Analysis
Use the BuildersLens 65-Signal Analyzer to see live macro positioning for tickers mentioned in this article:
→ Analyze TLT (Long-Term Treasuries)
→ Analyze HYG (High Yield Credit)
📊 Run Your Own Analysis
Use the BuildersLens 65-Signal Analyzer for live macro positioning:
→ Analyze HYG (High Yield Credit)
This article is for educational and informational purposes only and does not constitute investment advice. Past performance is not indicative of future results. Consult with a qualified financial advisor before making investment decisions.