Research · Cycle Sequencing & Phases
GDP Runs Hot, Bond Market Pushes Back: Sequencing the Late-Cycle Constraint

GDP Runs Hot, Bond Market Pushes Back: Sequencing the Late-Cycle Constraint
This discussion is not about predicting a recession or calling a market top. It is about sequencing. Specifically, how long policy-driven growth can run ahead of the funding system before the bond market reasserts constraint.
At the recent conference conversation with Stephanie Pomboy, the core tension was clear: near-term resilience versus structural limitation. Our Strategy translates that tension into phase mechanics rather than narrative positioning.
The Mechanism: Stimulus Impulse Meets Term Premium Reality
Front-loaded fiscal measures, tax refunds, deregulation, and pro-growth rhetoric can generate a temporary acceleration in headline activity. Consumption can lift quickly when cash enters household balance sheets. Asset prices can remain supported if liquidity remains available.
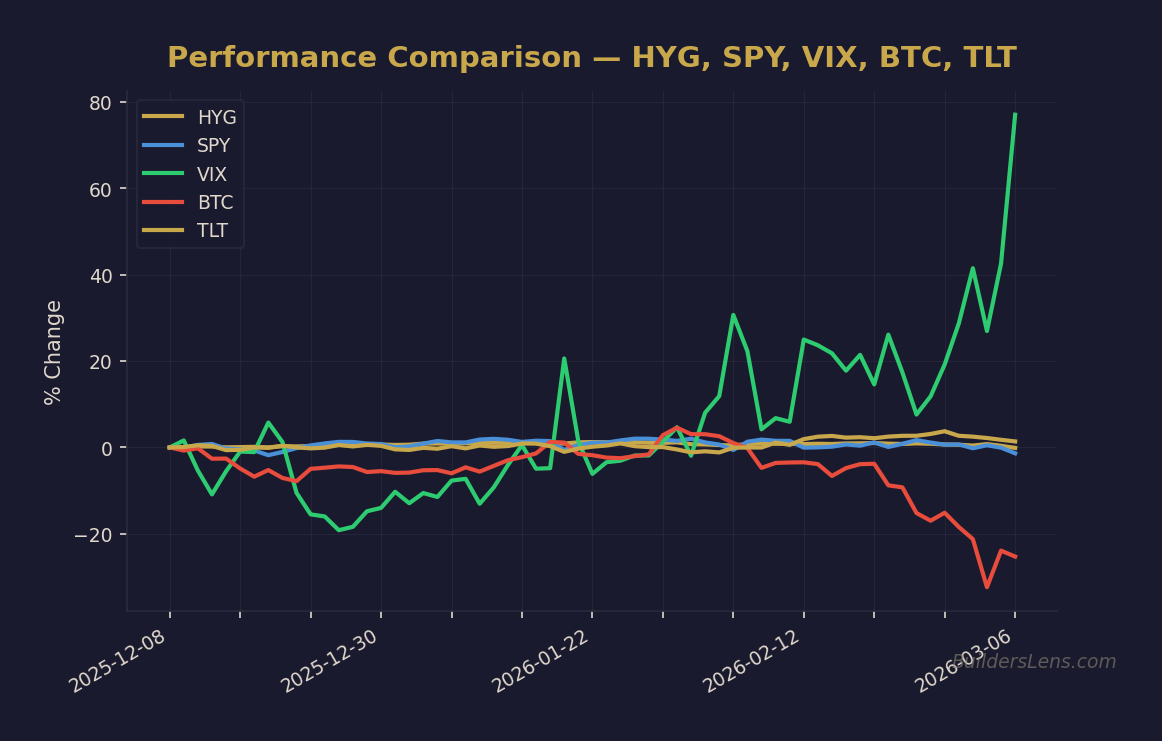
Source: BuildersLens.com Signal Framework | Data as of March 08, 2026
But stimulus does not remove constraints. It shifts timing.
If stronger growth coincides with firming commodity inputs, rising energy prices, and large deficit financing needs, long-term yields can move higher even without aggressive rate hikes. This is not a political statement. It is a clearing mechanism.
The bond market must absorb supply. If inflation uncertainty rises, the term premium adjusts.
Why Long-End Yields Matter More Than Headlines
Persistent increases in long-term yields tighten financial conditions regardless of policy rate guidance.
- Mortgage rates rise.
- Corporate refinancing costs increase.
- Equity multiples compress.
- Capital expenditure decisions become more cautious.
This is how late-cycle strength can quietly convert into late-cycle fragility.
We do not need recession forecasts to observe this transmission. We watch rates, spreads, and liquidity conditions.
Behavioral Transmission: Gasoline and Confidence
One practical signal discussed was the unusually tight relationship between retail gasoline prices and consumer confidence in recent years. Energy prices operate as a high-frequency behavioral trigger.
If gasoline prices rise persistently, confidence can soften rapidly. In a K-shaped economy where the top half drives marginal spending via asset appreciation, a simultaneous equity correction amplifies the effect.
Confidence shifts faster than traditional macro data. That makes it an early-phase stress indicator.
Institutional Friction at the Federal Reserve
Much attention was given to the potential posture of a future Federal Reserve chair. Our Strategy reframes that focus.
Individual preferences matter less than institutional friction. Committee dynamics, political pressure, financial stability considerations, and funding system realities constrain execution.
The relevant question is not “Is the chair hawkish?” It is “What are yields doing? What are auctions showing? Are spreads widening?”
Stablecoin Reserve Structures: A New Liquidity Channel?
Discussion also touched on stablecoin reserve frameworks as a potential liquidity distribution mechanism.
We translate this into two analytical questions:
- Does it alter marginal demand for short-duration government collateral?
- Does it accelerate the velocity of liquidity distribution relative to traditional fiscal channels?
If observable in funding data, such mechanisms could affect phase timing. If not, traditional deficit and term premium dynamics remain dominant.
Phase Mapping: Where We Sit
Current conditions align most closely with late Phase One dynamics: risk assets supported, growth resilient, but constraint risk rising beneath the surface.
We assign probability bands rather than outcomes.
- Now through late spring 2026: Approximately sixty to seventy percent probability of continued Phase One resilience.
- Early to mid-summer 2026: Approximately thirty to forty percent probability of Phase Two pressure if yields remain firm and spreads begin widening.
- Late 2026: Approximately twenty-five to thirty-five percent probability of Phase Three stress if funding conditions tighten materially.
These are conditional pathways, not forecasts.
Confirmation Signals vs Invalidation Signals
Confirmations of Rising Constraint Risk
- Persistent rise in long-term yields.
- Widening credit spreads.
- Firm commodity and energy prices.
- Weakening consumer confidence alongside higher gasoline prices.
- Rising cross-asset correlation.
Invalidations of the Stress Thesis
- Stable or falling long-end yields.
- Contained credit spreads.
- Clear disinflation without funding disruption.
- Healthy auction demand for government issuance.
Monitoring Dashboard
For observation only, not recommendations:
- Rates: US Ten-Year Yield, US Thirty-Year Yield
- Credit: High Yield Spreads
- Equities: SPY, Breadth Measures
- Volatility: VIX
- Energy: WTI Crude, Retail Gasoline Prices
- Liquidity Beta: BTC
Closing Framework
We are not forecasting collapse. We are identifying hinge variables.
Growth can run hot. Policy can generate a sugar rush. But if yields continue to climb while deficits expand, constraint emerges mechanically.
Our Strategy remains probability-based, signal-driven, and phase-sequenced. Optionality is preserved by monitoring transitions rather than predicting outcomes.
This material is educational in nature and is not investment advice.
Get the Daily Phase Brief
Signal changes, data releases to watch, and today’s regime assessment — delivered every morning before market open.
Join investors tracking the macro cycle. Unsubscribe anytime.
📊 Run Your Own Analysis
Use the BuildersLens 65-Signal Analyzer to see live macro positioning for tickers mentioned in this article:
→ Analyze TLT (Long-Term Treasuries)
📊 Run Your Own Analysis
Use the BuildersLens 65-Signal Analyzer to see live macro positioning for tickers mentioned in this article:
→ Analyze TLT (Long-Term Treasuries)
📊 Run Your Own Analysis
Use the BuildersLens 65-Signal Analyzer for live macro positioning:
→ Analyze HYG (High Yield Credit)
This article is for educational and informational purposes only and does not constitute investment advice. Past performance is not indicative of future results. Consult with a qualified financial advisor before making investment decisions.