Research · Cycle Sequencing & Phases
Gold Parabolic, Volatility Quiet: Our Strategy’s Late-Cycle Risk Map
Strategy Anchor
In Our Strategy, we operate a probability-based, phase-sequenced framework. We do not try to predict a single outcome. We track signals, map transmission, and only scale exposure when confirmations accumulate. Optionality stays central: the ability to respond to a regime shift matters more than being first with a narrative.
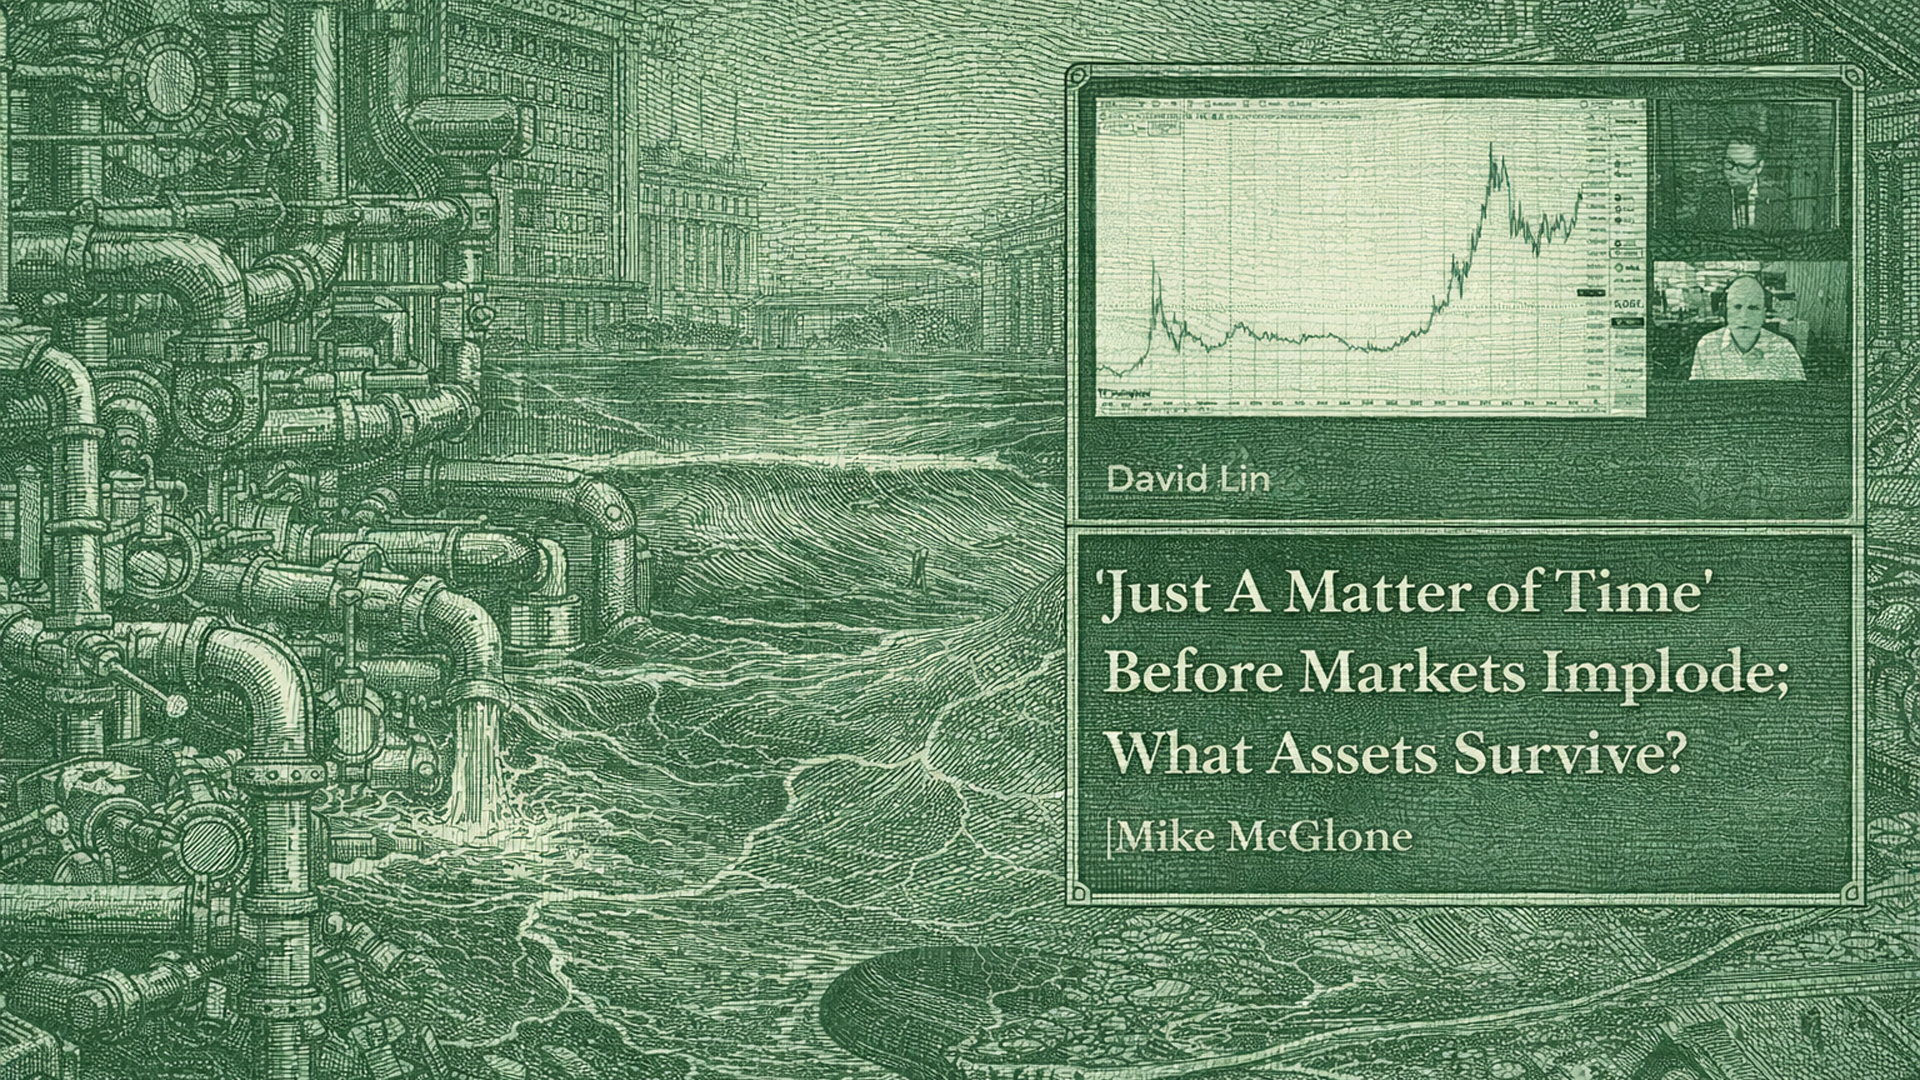
What the Interview Is Claiming
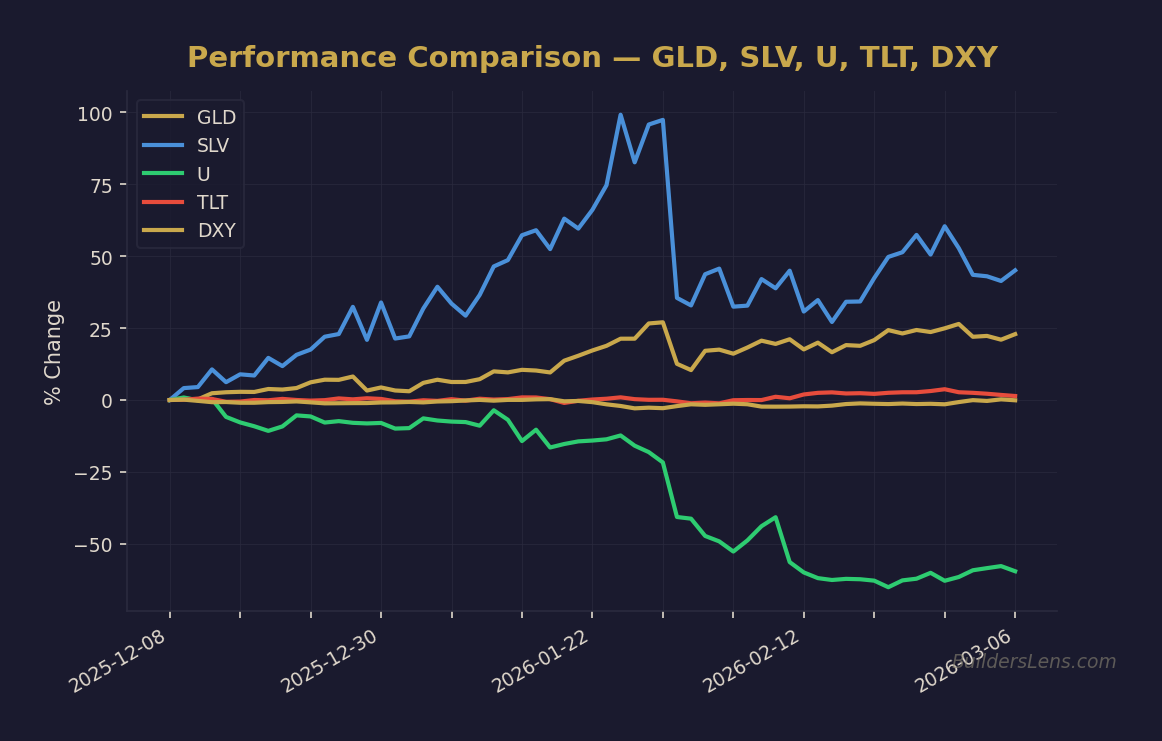
The interview argues that multiple late-cycle extremes are coexisting: equity volatility is unusually low while equities sit near highs, gold and silver have surged aggressively, and crypto is behaving like a weakening liquidity-beta complex. The core claim is that mean reversion is likely—and that in a genuine risk-off, deflationary impulse, long-duration U.S. Treasuries become the primary “survivor” asset. The source interview was recorded February 9, 2026.
Source: BuildersLens.com Signal Framework | Data as of March 08, 2026
Signal Classification
- Volatility / market internals: suppressed volatility as a late-cycle fragility signal
- Risk appetite / positioning: crowding and leverage as hidden accelerants
- Rates / yield direction: long-end yields as the pivot for duration convexity
- Liquidity plumbing / funding: stress transmission through forced de-risking
- Credit: containment (Phase 2) vs widening (Phase 3 acceleration)
- Dollar / global funding: dollar strength as a constraint on global risk
- Real assets: parabolic moves as flow/positioning signals, not stable fundamentals
Mechanism: How “Implosion” Actually Happens
Our Strategy translates “implosion” language into a mechanical sequence. Most disorderly drawdowns are not a single event—they are a chain reaction:
- Volatility reprices upward from an unusually low base.
- Systematic de-risking follows (vol-control, risk parity, CTA-type behavior), turning price into flow.
- Credit becomes the accelerant. If spreads widen persistently, refinancing stress rises and risk becomes nonlinear.
- Funding tightens. Auction stress, term premium, and dollar strength can compress liquidity and raise correlations.
- Correlations rise. Assets that looked diversified can fall together, especially if they were all levered to “risk staying easy.”
This is why Our Strategy cares less about dramatic targets and more about confirmations. Markets can ignore warnings for longer than expected if liquidity stays smooth and credit remains contained.
Phase Mapping: Where This Fits in Our 5-Phase Model
The interview’s tone leans Phase 3–4 (breakdown/capitulation language). Our mapping is more conservative: it supports a late Phase 1 drifting into Phase 2 setup. The deciding line is whether a volatility reversion stays “contained compression” (Phase 2) or becomes “credit/funding stress” (Phase 3).
Probability Timeline (Date-Anchored, Not Predictive)
We anchor probabilities to confirmations and phase pressure—not to forecasts. The dates below are planning windows, not promises.
- June 2026: Phase 2 compression probability elevated; Phase 3 tail risk depends on credit and funding confirmations.
- December 2026: If credit widens and funding tightens, Phase 3–4 pathway probability rises; if credit remains contained, Phase 2 can persist longer than expected.
- June 2027: Higher likelihood we are either in Phase 5 stabilization (post-stress) or still in a policy-delay extension—confirmation decides.
Current phase probabilities (today):
- Phase 1 continuation: 25–40%
- Phase 2 next: 40–55%
- Phase 3 thereafter: 15–30%
- Phase 4 tail (capitulation window): 5–15%
What Changes in Our Strategy
- We treat “parabolic” behavior as a risk-density signal, not an invitation to chase.
- We raise the importance of credit + funding confirmation before assuming a Phase 3 pathway.
- We prepare sequences in advance: compression management in Phase 2, defensive sequencing if Phase 3 confirms, ladder discipline if Phase 4 appears.
What Does Not Change
- We do not anchor planning to single-asset price targets.
- We do not flip regimes based on headlines or one interview.
- We do not deploy in one move; Our Strategy remains tranche-based and confirmation-driven.
- We do not confuse reflex rallies with stabilization; stabilization requires credit, funding, and breadth improvement together.
Action Checklist: What We Watch Next
- Credit spreads (HY/IG): containment vs persistent widening
- Treasury auctions / term premium: is duration payoff delayed by sticky long yields?
- Dollar strength: tightening constraint on global risk
- Breadth: narrowing leadership as late-cycle fragility
- Volatility regime: does vol rise and stay elevated?
Invalidation Conditions
- Volatility rises modestly but markets digest it with stable credit (Phase 2 remains primary)
- Metals cool without a broader correlation shock (localized positioning unwind)
- Equity breadth improves meaningfully while funding remains smooth (Phase 1 extension more likely)
Bottom line: Our Strategy doesn’t need a dramatic narrative. We need a clean map of signals, phase pressure, and confirmation triggers—so we can respond without guessing.
Get the Daily Phase Brief
Signal changes, data releases to watch, and today’s regime assessment — delivered every morning before market open.
Join investors tracking the macro cycle. Unsubscribe anytime.
📊 Run Your Own Analysis
Use the BuildersLens 65-Signal Analyzer for live macro positioning:
→ Analyze HYG (High Yield Credit)
This article is for educational and informational purposes only and does not constitute investment advice. Past performance is not indicative of future results. Consult with a qualified financial advisor before making investment decisions.