Research · Cycle Sequencing & Phases
Housing Demand Is Collapsing — But Prices Haven’t Broken

Housing Demand Has Collapsed — But Has the Cycle Shifted?
The U.S. housing market is exhibiting one of the lowest turnover environments on record. Demand has declined materially from pandemic-era peaks, affordability remains historically stretched, and regional divergences are widening. Yet national prices remain near cycle highs.
In Our Strategy, divergence between demand and price is not interpreted as stability. It is interpreted as friction.
Affordability as a Cash-Flow Constraint
Mortgage payments as a share of income remain elevated due to the combined effects of higher mortgage rates, insurance costs, property taxes, and home prices. This is not simply a confidence issue. It is a structural cash-flow constraint.
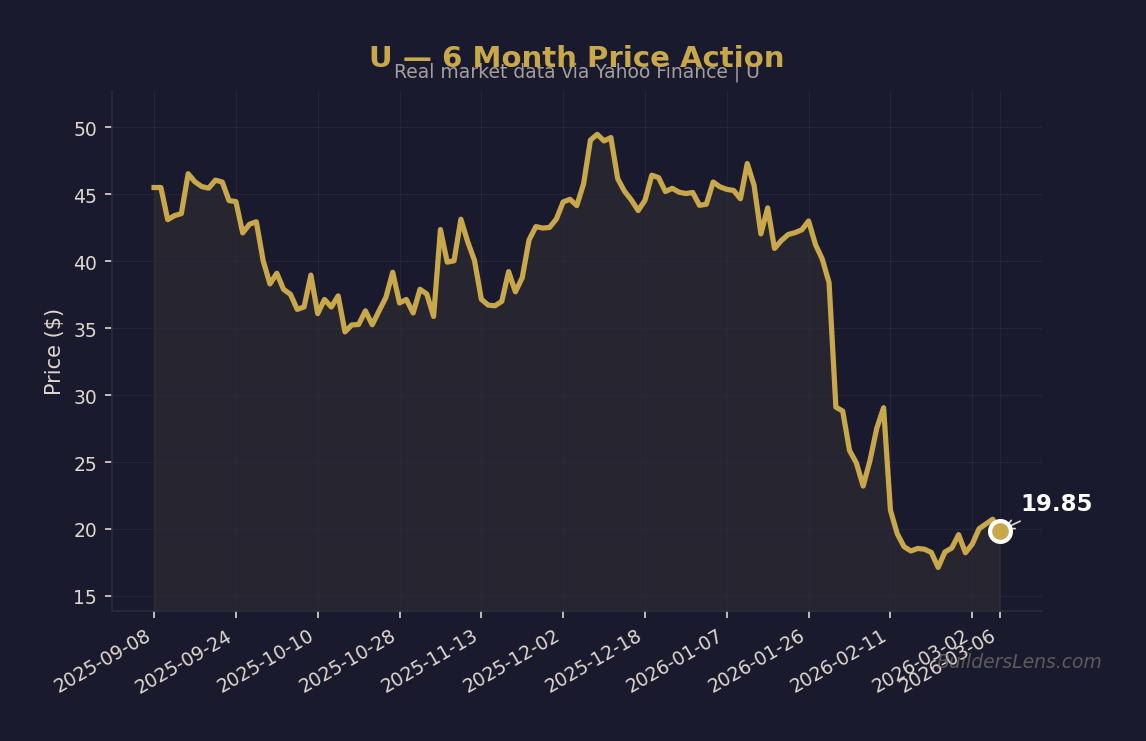
Source: BuildersLens.com Signal Framework | Data as of March 08, 2026
When affordability compression persists, demand does not recover through narrative shifts. It recovers through one of three mechanisms: price adjustment, income growth, or sustained rate compression.
Absent those, turnover remains suppressed.
Demand Collapse vs Price Rigidity
Existing home sale turnover has fallen to historically low levels. In prior cycles, including 2008, turnover rebounded more quickly. Today, sellers with equity cushions can delay price discovery.
However, delay is not elimination. Rising carrying costs and negative equity pockets reduce the duration of seller optionality.
This creates phase pressure, not immediate collapse.
Negative Equity as a Reflexive Multiplier
Negative equity remains well below systemic 2008 levels. However, localized increases in Florida, Texas, and parts of Colorado represent early-stage stress indicators.
Negative equity becomes systemically relevant only when paired with labor deterioration and tightening credit conditions. Alone, it is a regional adjustment variable. Combined with labor rollover, it can accelerate phase transitions.
Regional Divergence and Migration Normalization
Sun Belt markets that experienced peak pandemic-era migration are now adjusting to normalized migration flows. Builders expanded supply during peak demand regimes. As migration slowed, supply-demand balances shifted.
Meanwhile, parts of the Midwest and Northeast remain firm but increasingly overvalued relative to local fundamentals.
Historically, divergences resolve. The open question is whether resolution occurs through price adjustment or economic acceleration.
Why Rate Cuts Have Not Restored Demand
Incremental policy easing does not immediately repair structural affordability constraints. Housing adjusts more slowly than financial markets. It clears through time or price — not sentiment.
Phase Mapping and Probability Bands
As of February 2026, we assess:
- Phase 1 continuation into June 2026: approximately 55%
- Transition toward broader Phase 2 housing-linked stress by December 2026: approximately 30%
- Extended stabilization without a material price reset: approximately 15%
Probabilities rise toward Phase 2 if labor hiring rates deteriorate and regional delinquencies broaden across multiple states.
What We Monitor
- Mortgage delinquencies and foreclosure activity
- Hiring rate deterioration and unemployment drift
- Regional bank credit tightening
- Listings relative to turnover
- Mortgage rate trajectory and term structure behavior
What Changes vs What Does Not
What changes: Housing reinforces optionality and increases sensitivity to labor and credit transmission risk.
What does not change: There is no confirmation of a 2008-style cascade. Financial markets can remain resilient even while housing stagnates. Collapse narratives remain unconfirmed.
Conclusion
Housing today represents pressure, not rupture. In Our Strategy, we track transmission mechanisms rather than headlines. We emphasize sequencing over timing, confirmation over anticipation, and probabilities over conviction.
We do not need to be early. We just cannot afford to be late.
Get the Daily Phase Brief
Signal changes, data releases to watch, and today’s regime assessment — delivered every morning before market open.
Join investors tracking the macro cycle. Unsubscribe anytime.
📊 Run Your Own Analysis
Use the BuildersLens 65-Signal Analyzer to see live macro positioning for tickers mentioned in this article:
This article is for educational and informational purposes only and does not constitute investment advice. Past performance is not indicative of future results. Consult with a qualified financial advisor before making investment decisions.