Research · Cycle Sequencing & Phases
Housing Is Repricing Through Time, Not Just Price
Housing Is Repricing Through Time, Not Just Price
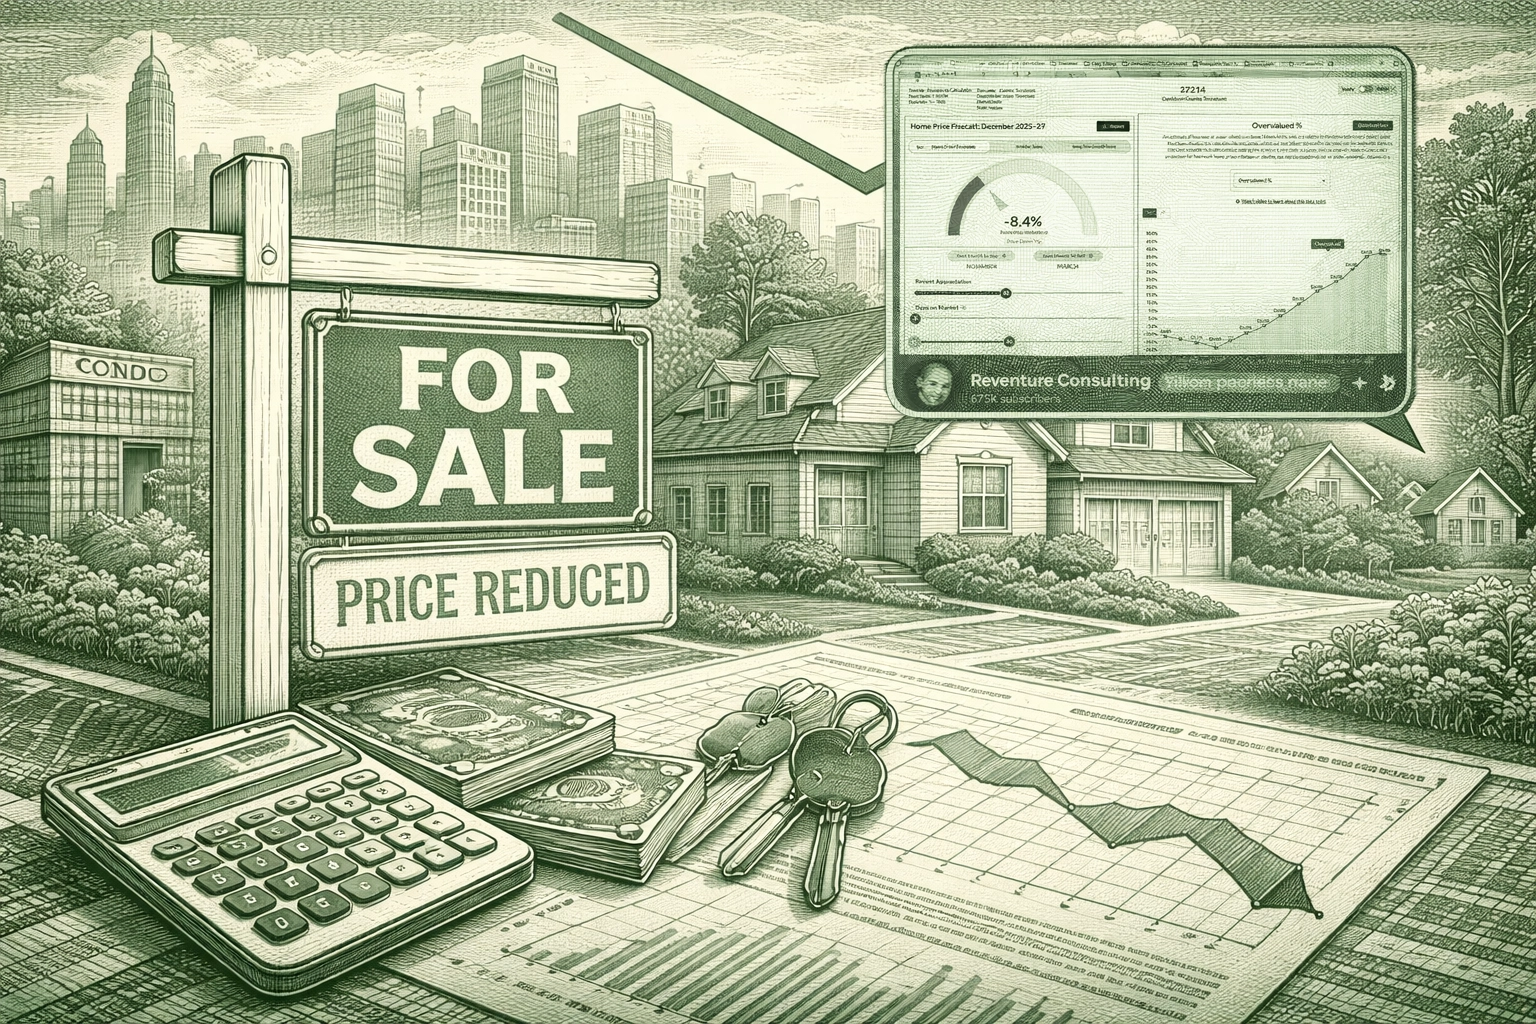
In Our Strategy, we treat housing as a slow-moving confirmation engine. Unlike liquid markets, housing rarely reprices in one clean step. It tends to move in a sequence: first time (days on market), then concessions (rate buydowns, credits, repairs), and only later headline price.
That sequencing is why home values can drift down for months and still feel unaffordable. Payments, uncertainty, and carry costs can remain the binding constraint even when sticker prices soften. This is less about narrative and more about arithmetic and behavior.
Recent datapoints reinforce the “slow repricing” setup. Zillow’s January 2026 market report notes U.S. home values declined on a monthly basis for the sixth consecutive month, alongside marginal affordability improvement for buyers. Redfin reports the typical U.S. home that sold in January spent the longest time in years on the market before going under contract, with pending sales still down year over year.
Source: BuildersLens.com Signal Framework | Data as of March 08, 2026
What The Reviewed Video Is Claiming
The reviewed livestream argues that early 2026 has not produced a broad-based housing rebound. Demand remains soft, days on market are rising, and inventory has improved in many regions. It also highlights that condos are correcting more aggressively, partly because HOA dues, insurance costs, and special assessments change the true economics of ownership. Finally, it emphasizes that weakening rents in many Sunbelt metros reduce urgency for buyers to take on high monthly payments.
Our Strategy does not treat any single metro as “the” national outcome. We translate these points into a mechanism-first framework: what is changing, what is not, and what would confirm the next phase of the housing cycle.
Our Strategy Signal Buckets
We organize housing signals into a small number of buckets that map cleanly into phase pressure. This helps avoid headline chasing and keeps the process confirmation-driven.
- Affordability and payments: the mortgage payment is the real clearing price.
- Demand and time-to-contract: caution shows up as longer days on market before it shows up in price indexes.
- Inventory and listings: rising options shift negotiation power even if totals remain below prior-cycle peaks.
- Carry costs: insurance, taxes, HOA dues, and special assessments can reprice ownership faster than home values do.
- Rent as shadow price: rent trends shape the buy-versus-rent incentive and influence buyer urgency.
- Credit and spillovers: when housing stress transmits into credit and employment, phase pressure changes materially.
Mechanism: How Housing Reprices In Cycles
1) Demand typically breaks before prices do
When monthly payments are elevated, buyers do not need a bearish narrative to pause; the math does it. Demand weakens first because sellers resist price cuts and buyers wait for either lower payments or clearer economic confidence. That is why days on market and pending-sales trends often lead national price indexes.
2) Concessions rise before visible price discovery
Sellers often try to protect the headline price via concessions: credits, rate buydowns, repairs, and closing incentives. Over time, as listings linger and buyer leverage rises, concessions become insufficient and price cuts broaden. This is one reason monthly declines can persist while the market still “feels expensive.”
3) Condos can lead because the building has a balance sheet
Condos embed building-level tail risks: insurance repricing, deferred maintenance, regulatory compliance, and special assessments. These costs can change quickly, shrinking the qualified buyer pool even if the listing price falls. This helps explain why condo segments can experience sharper and faster price discovery than single-family homes.
4) Rents change buyer urgency
Housing is a choice set: rent or buy. If rents soften while ownership costs remain high, the incentive to “lock in” a purchase weakens. That reduces urgency, extends time-to-sale, and increases the probability that the market clears through concessions and then price. This matters most in recently built, supply-heavy metros where rental competition is strongest.
5) Why this can stay “quiet” for a while
Housing can weaken without immediately breaking broader risk assets because its transmission is slow. Macro impact becomes material when weakness hits labor, consumer confidence, credit performance, or regional liquidity conditions. Our Strategy watches for this escalation pathway rather than assuming housing weakness automatically equals a fast macro downturn.
Phase Mapping: Where Housing Fits In Our Framework
BuildersLens currently frames the broader regime as late Phase 1 with rising Phase 2 probability: liquidity has been supportive, but stress signals are no longer improving in a clean, broad way. Housing behavior aligns with that setup: a slow grind, rising dispersion, and localized breakage rather than one national event.
- Phase 1 continuation: headline resilience can persist even while affordability remains strained and demand stays cautious.
- Rising Phase 2 pressure: longer days on market, broader concessions, and segment-led weakness increase stress density.
- Phase 3 is not assumed: it requires confirmation through credit repricing, labor deterioration, or policy losing marginal effectiveness.
Probability Timeline: Sequencing Over Prediction
We do not forecast a single outcome. We assign probabilities to phase pressure and update them as confirmations arrive. The goal is not certainty. The goal is staying aligned with signals as they persist or fade.
Now to June 2026
- Phase 1 continuation (slow grind, dispersed softness): 45 to 60 percent
- Phase 2 acceleration (broader demand recession and rising carry-cost stress): 30 to 45 percent
- Early Phase 3 transition (credit or labor spillover): 10 to 20 percent
June 2026 to December 2026
- Phase 1 continuation: 35 to 50 percent
- Phase 2 dominance: 35 to 55 percent
- Phase 3 emergence: 15 to 30 percent
December 2026 to June 2027
- Phase 1 continuation: 25 to 40 percent
- Phase 2 persistence: 35 to 55 percent
- Phase 3 transition: 20 to 40 percent
These ranges tighten or widen based on confirmations. Our Strategy treats housing as one of the slowest, clearest confirmation engines for whether stress is spreading or staying local.
What We Watch Next: Confirmations Versus Invalidations
Confirmations that Phase 2 pressure is rising
- Days on market continues to rise across multiple regions, not just a single metro.
- Concessions broaden and become standard rather than exceptional.
- Rent softness persists and spreads beyond a few supply-heavy metros.
- Condo financeability worsens as building-level risks reprice.
- Housing softness begins to show up in credit and labor channels.
Invalidations that would reduce the weight of this setup
- Mortgage payments fall meaningfully and sustain, and demand responds with faster time-to-contract.
- Inventory stops accumulating and days on market compresses broadly.
- Rents re-accelerate across multiple regions, restoring buy urgency.
- Carry-cost shocks fade: fewer assessment surprises, stabilizing insurance and HOA trajectories.
What Changes In Our Strategy
- We increase weight on time-to-sale and concessions as primary early signals, not lagged price indexes.
- We treat condos and HOA-heavy product as higher-sensitivity indicators of carry-cost repricing.
- We monitor rent trends as the shadow price of housing demand, especially in supply-heavy metros.
- We watch for spillovers into credit and employment, which would materially change phase pressure.
- We keep optionality by staying confirmation-driven rather than outcome-driven.
What Does Not Change
- We do not treat one metro’s move as “the” national outcome.
- We do not assume rate changes automatically restart demand.
- We do not confuse marginal affordability improvement with restored affordability.
- We prioritize mechanisms over narratives, signals over outcomes, and probabilities over conviction.
Monitoring List (Observation Only)
This is a monitoring list, not an action list. These are common observation proxies for housing, rates, credit, and regional sensitivity.
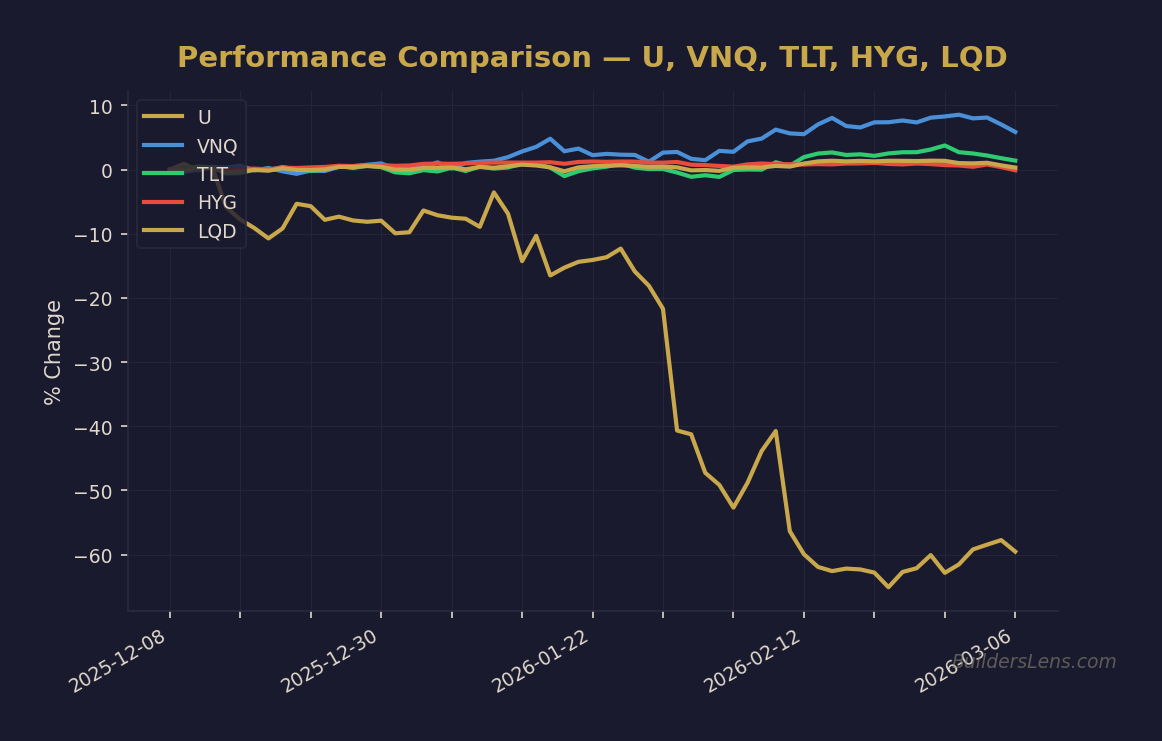
- Housing and real estate: ITB, XHB, VNQ
- Mortgage and rates sensitivity: MBB, IEF, TLT
- Credit conditions: HYG, LQD
- Regional-bank sensitivity: KRE
- Liquidity and broad risk: SPY, QQQ
Closing Thought
Housing does not need to collapse to matter. It only needs to quietly stop working the way it used to. A slow repricing process can still change buyer behavior, reduce urgency, and eventually transmit into broader macro channels.
Our Strategy does not need to be early. We stay aligned with confirmations as they persist, and we reduce weight when invalidations appear. That is how we keep optionality and avoid narrative traps in slow-moving cycles like housing.
Educational disclaimer: This content is for educational purposes only and does not constitute financial or investment advice.
Get the Daily Phase Brief
Signal changes, data releases to watch, and today’s regime assessment — delivered every morning before market open.
Join investors tracking the macro cycle. Unsubscribe anytime.
📊 Run Your Own Analysis
Use the BuildersLens 65-Signal Analyzer for live macro positioning:
→ Analyze HYG (High Yield Credit)
This article is for educational and informational purposes only and does not constitute investment advice. Past performance is not indicative of future results. Consult with a qualified financial advisor before making investment decisions.