Research · Cycle Sequencing & Phases
How Market Cycles Reveal Hidden Turning Points
Price, Pattern, and Time: Translating Trading Language Into Macro Mechanisms
Our Strategy treats this interview as an opportunity to reconcile two worlds that are often kept separate: intraday trading language and macro regime discipline. The guest frames technical analysis as price, pattern, and time, with an emphasis on repeatable cycles. Our translation is more constrained and more durable: markets are auctions, and auctions are governed by participation, liquidity, and funding constraints. Those constraints create rhythms that can look like cycles.
This post is not a defense of indicators and not a dismissal of them. It is a framework for when technical tools become more reliable, when they become brittle, and why the same chart pattern can behave differently across regimes. We focus on mechanisms over narratives, signals over outcomes, sequencing over timing, and probabilities over conviction.
Source: BuildersLens.com Signal Framework | Data as of March 08, 2026
The core mechanism: auctions change when participation changes
The most useful takeaway from this discussion is not that time is mystical. It is that time is a proxy for participation. Intraday, participation clusters. The first hour often concentrates information discovery, forced repositioning, and volatility. Midday tends to have thinner volume, slower discovery, and higher emotional exposure because positions stagnate rather than resolve.
Our Strategy generalizes this idea. The probability of a move is not just about a level. It is about a level plus the likelihood of forced action at that moment. When traders avoid high-information windows because they feel chaotic, they often enter later when the auction is thin. Thin can feel safe, but thin environments are where mistakes compound because price does not resolve quickly.
Stacking factors is simply probability alignment
Using a single indicator is a single perspective. Stacking factors is a probabilistic vote count across independent dimensions:
- Structure: Support, resistance, and trend integrity.
- Participation: Volume regimes, liquidity windows, and behavioral positioning.
- Context: Macro regime pressure from credit, rates, and liquidity conditions.
Technical analysis becomes durable when it is embedded inside regime recognition. Without liquidity context, levels can appear reliable until they suddenly are not. With context, technical tools become diagnostics rather than prediction devices.
Cycles and time: structure, not certainty
Time windows matter because participation and constraints change. That does not require mystical interpretation. Markets become repeatable because liquidity conditions, funding costs, and human behavior repeat. The discipline is recognizing time as a structural variable, not a predictive guarantee.
Our Strategy uses confirmation-driven analysis. Time may suggest an exhaustion window, but confirmation must still come from breadth, credit, liquidity, rates, and volatility behavior.
Framework mapping: Our Strategy phase sequencing
We translate the concept of cycles into our five-phase macro framework. This is educational and non-advisory.
Current Phase Assessment
Late Phase One with rising Phase Two probability remains the most consistent interpretation. Surface stability can persist while internal fragility builds through liquidity sensitivity and participation concentration.
Date-Anchored Probability Timeline
- Through June 2026: Approximately sixty percent probability that late Phase One compression behavior persists, conditional on stable funding and contained credit spreads.
- By December 2026: Approximately thirty percent probability that Phase Two pressure escalates through funding and duration stress.
- By June 2027: Approximately ten to twenty percent probability that deeper policy-driven instability becomes relevant if credit becomes the transmission channel.
What to watch: confirmations versus invalidations
Confirmations of rising pressure
- Deteriorating market breadth and participation.
- Widening credit spreads.
- Volatility rising and failing to compress.
- Long-term yields remaining elevated due to term premium and funding stress.
Invalidations of deterioration
- Broad participation across sectors.
- Stable credit and funding conditions.
- Clean auction demand and compressing term premium.
- Durable liquidity expansion.
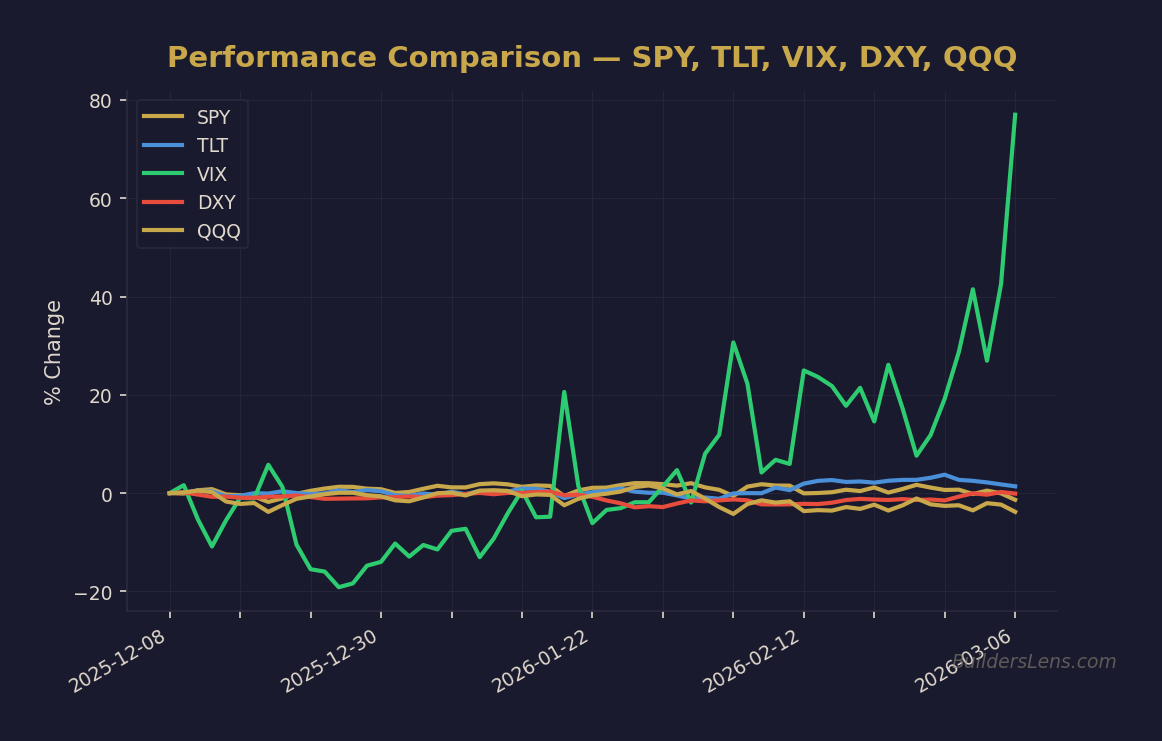
Monitoring instruments for observation
These are observation tools only, not signals or recommendations. They help map regime pressure:
- SPY for broad market participation
- SMH and AIQ for concentration leadership
- TLT and ZROZ for duration sensitivity
- VIX for volatility regime changes
- DXY for funding pressure and liquidity constraints
Conclusion: repetition comes from constraints
The durable takeaway is not that cycles predict the future. The takeaway is that markets become repeatable when constraints repeat. Participation clusters. Liquidity tightens and loosens. Human behavior oscillates between fear and optimism. Recognizing these patterns allows us to shift from prediction to probability.
Educational analysis only. This content is not financial advice and does not consider individual circumstances.
Get the Daily Phase Brief
Signal changes, data releases to watch, and today’s regime assessment — delivered every morning before market open.
Join investors tracking the macro cycle. Unsubscribe anytime.
📊 Run Your Own Analysis
Use the BuildersLens 65-Signal Analyzer to see live macro positioning for tickers mentioned in this article:
→ Analyze TLT (Long-Term Treasuries)
📊 Run Your Own Analysis
Use the BuildersLens 65-Signal Analyzer to see live macro positioning for tickers mentioned in this article:
→ Analyze TLT (Long-Term Treasuries)
📊 Run Your Own Analysis
Use the BuildersLens 65-Signal Analyzer for live macro positioning:
This article is for educational and informational purposes only and does not constitute investment advice. Past performance is not indicative of future results. Consult with a qualified financial advisor before making investment decisions.