Research · Macro Regime
Inflation Is Cooling — So Why Does Everything Feel More Expensive?

Inflation Cooling vs. Affordability Compression: A Phase-Sequenced Analysis
Headline inflation prints have moderated. However, cumulative price levels across housing, insurance, healthcare, and financing costs remain structurally elevated relative to twenty nineteen baselines. Our Strategy distinguishes between rate of change and absolute level repricing. The latter is what drives affordability stress.
Affordability compression occurs when cumulative cost floors rise faster than sustainable income growth. This creates reliance on credit extension to bridge the gap. Over time, debt servicing costs, refinancing friction, and collateral repricing amplify fragility.
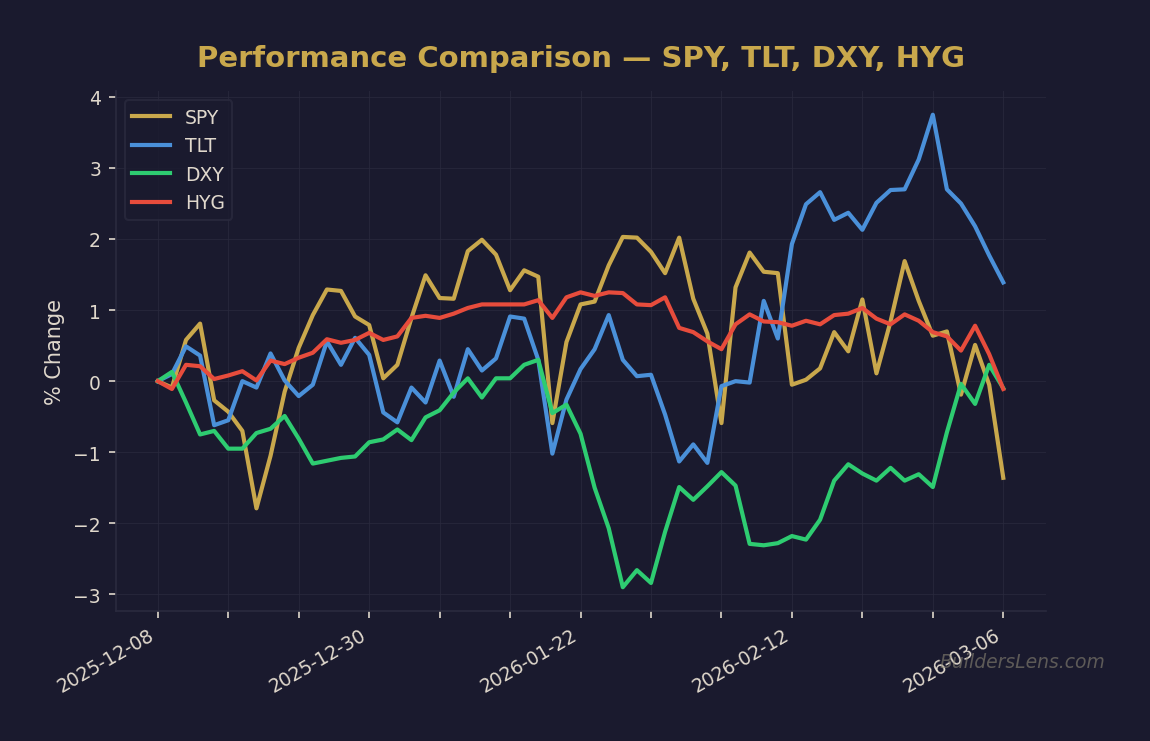
Source: BuildersLens.com Signal Framework | Data as of March 08, 2026
Mechanism: From Cooling Inflation to Structural Compression
1. Cumulative Price Repricing
Even with inflation moderating toward two to three percent, the aggregate price level remains materially above pre-pandemic benchmarks. Shelter, insurance, and financing costs exhibit sticky structural characteristics.
2. Wage Lag and Credit Dependence
Real wage growth has not uniformly offset shelter cost repricing. Consumer credit balances and refinancing constraints become temporary stabilizers. This delays stress rather than eliminating it.
3. Housing as Transmission Channel
Housing represents both the largest household expenditure and a primary collateral base. When ownership affordability deteriorates, rental demand increases. When rental supply remains constrained, pricing power concentrates.
Framework Mapping: Our Strategy Phase Alignment
Current signal alignment is most consistent with late Phase One (Melt-Up with Compression Building) transitioning toward Phase Two (Multiple Compression / Rotation).
- Labor: Hiring rate trends and underemployment metrics remain critical.
- Credit: Consumer delinquencies and lending standards determine escalation probability.
- Yields: Long-duration yield behavior indicates whether term premium persists.
- Housing: Inventory, vacancy rates, and builder pricing signal structural stress.
Date-Anchored Probability Sequencing
Through June 2026
Phase One continuation probability: approximately sixty percent. Affordability compression persists without systemic break.
By December 2026
Phase Two to Phase Three transition probability: approximately thirty percent. Requires labor weakening combined with credit stress and elevated long yields.
Through June 2027
Phase Four forced liquidity window probability: approximately twenty percent conditional on credit acceleration.
Phase Five stabilization probability: contingent upon policy response and liquidity expansion following stress confirmation.
What Changes vs. What Does Not Change
What Changes
- Income thresholds for perceived financial stability continue repricing higher.
- Rental demand dynamics shift toward smaller units and shared living structures.
- Credit dependence rises as affordability narrows.
What Does Not Change
- Cumulative price levels remain elevated even as inflation slows.
- Housing remains the dominant macro transmission channel.
- Liquidity and credit ultimately determine systemic phase shifts.
Monitoring Dashboard (Observation Only)
- SPY – Broad equity risk sentiment
- TLT – Long-duration yield behavior
- DXY – Dollar funding conditions
- Housing inventory and vacancy metrics
- Consumer credit delinquency trends
These instruments are observation tools within the framework. They are not trading signals.
Invalidation Conditions
- Sustained real wage growth exceeding shelter cost growth.
- Meaningful housing supply expansion reducing rental pressure.
- Structural compression of long-term yields without credit stress.
- Credit spreads remaining stable despite affordability deterioration.
If these signals materialize simultaneously, Phase Two pressure diminishes materially.
Conclusion
Cooling inflation does not equal restored affordability. Structural cost floors matter more than headline prints. Our Strategy remains confirmation-driven. We monitor labor, credit, yields, and housing transmission channels for evidence that compression transitions into forced liquidity.
This analysis is educational and non-advisory. It reflects probability-weighted scenario modeling within a regime-based framework.
Get the Daily Phase Brief
Signal changes, data releases to watch, and today’s regime assessment — delivered every morning before market open.
Join investors tracking the macro cycle. Unsubscribe anytime.
📊 Run Your Own Analysis
Use the BuildersLens 65-Signal Analyzer for live macro positioning:
→ Analyze HYG (High Yield Credit)
This article is for educational and informational purposes only and does not constitute investment advice. Past performance is not indicative of future results. Consult with a qualified financial advisor before making investment decisions.