Research · Uncategorized
Kondratiev Wave (K-Wave)
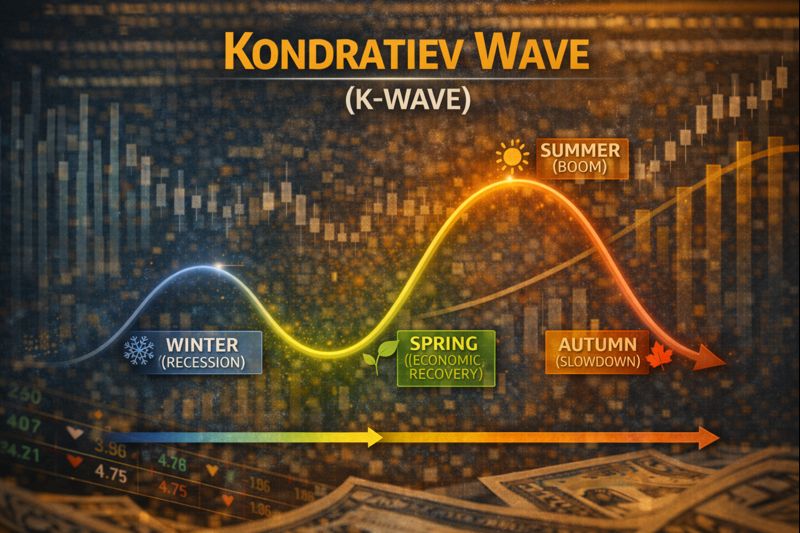
The Kondratiev Wave (K-Wave)
Why Long-Term Resets Occur — Without Telling Us When
The Kondratiev Wave, often called the K-Wave,
is one of the most misunderstood concepts in macroeconomics.
It is frequently misused as a timing tool,
a doomsday clock, or a deterministic forecast.
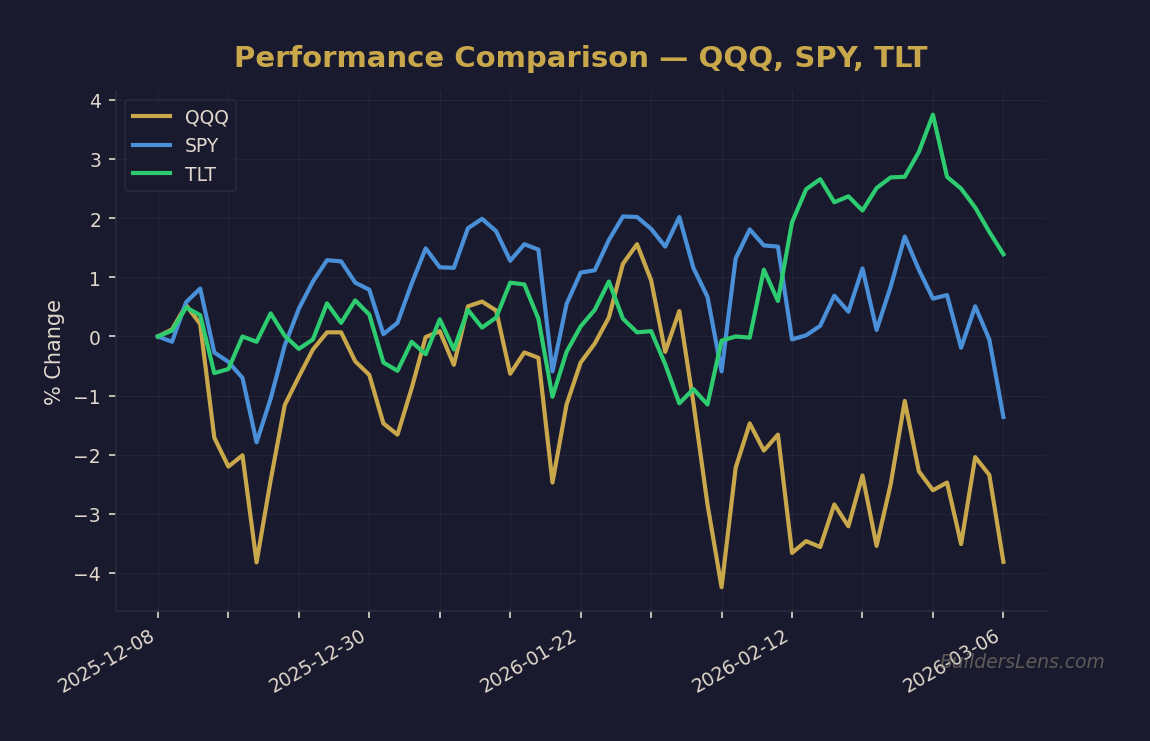
Source: BuildersLens.com Signal Framework | Data as of March 08, 2026
At BuildersLens, we treat the K-Wave very differently.
Not as a prediction —
but as long-term structural context
that helps explain why economic resets recur across history.
What Is the Kondratiev Wave? (Plain English)
The Kondratiev Wave is a theory that economies move
in long cycles lasting several decades.
These cycles are driven not by markets alone,
but by deeper forces such as:
- Technological change
- Capital investment cycles
- Debt accumulation and resolution
- Institutional adaptation
In simple terms:
Over long periods, systems build complexity —
and eventually require simplification.
Why the K-Wave Is Often Misused
The K-Wave is sometimes presented as:
- A fixed 50–60 year clock
- A guarantee of collapse
- A precise forecast tool
None of these interpretations are reliable.
Long waves vary widely in length and expression.
Human systems are adaptive, not mechanical.
The value of the K-Wave lies in recognizing
long-term pressures —
not predicting specific events.
What the K-Wave Actually Describes
Over multiple business cycles:
- Debt accumulates faster than productive capacity
- Institutions become more complex
- Returns on capital diminish
Innovation and policy temporarily extend the cycle.
Eventually, constraints dominate.
The K-Wave describes this broad arc:
Expansion → Saturation → Reset → Renewal
Where the K-Wave Fits in the Five Phases
The Kondratiev Wave does not map to a single phase.
It spans multiple iterations of the Five Phases.
It explains why the framework repeats —
not how it unfolds day to day.
Phase 0 — Post-Crisis Expansion
Phase 0 often appears near the beginning
of a new long wave.
- Debt burdens have been reduced
- Institutions regain legitimacy
- Innovation finds fertile ground
Phase 1 — Melt-Up / Liquidity Illusion
During Phase 1:
- Capital flows freely
- Optimism dominates
- Structural imbalances grow quietly
Late in the long wave,
Phase 1 excesses become larger and more distorted.
Phase 2 — Crack Formation / Rolling Stress
In Phase 2:
- Returns diminish
- Policy effectiveness declines
- Complex systems begin to strain
These pressures are amplified
when the long wave is mature.
Phase 3 — Forced Liquidation / Policy Loss of Control
Phase 3 often coincides with
a local resolution inside the long wave.
- Debt is forced to clear
- Institutions are challenged
- Assumptions are reset
This does not end the long wave —
it reshapes it.
Phase 4 — Reset / Accumulation
Phase 4 is where long-wave renewal begins.
- New technologies gain traction
- Capital is redeployed
- Structural opportunities re-emerge
This is the bridge into the next era.
Get the Daily Phase Brief
Signal changes, data releases to watch, and today’s regime assessment — delivered every morning before market open.
Join investors tracking the macro cycle. Unsubscribe anytime.
Where We Are Today
Today’s environment shows several characteristics
associated with a mature long wave:
- High debt burdens
- Heavy reliance on policy intervention
- Compressed forward returns
In Five Phases terms:
The K-Wave provides the background
that makes Phase 1 distortions larger,
Phase📊 Run Your Own Analysis
Use the BuildersLens 65-Signal Analyzer for live macro positioning:
This article is for educational and informational purposes only and does not constitute investment advice. Past performance is not indicative of future results. Consult with a qualified financial advisor before making investment decisions.