Research · Cycle Sequencing & Phases
Labor Is Rolling Over—Why Risk Assets Reacted First
Strategy Anchor
In Our Strategy, we run a probability-based, phase-sequenced framework. We are not trying to predict a single outcome.
We track signals, map transmission, and only escalate conviction when confirmations stack. The key discipline is optionality:
we accept uncertainty, but we refuse to be unprepared.
What the source video is claiming
The discussion argues that early-2026 markets were positioned for an economic rebound, but the labor data is behaving as if
deterioration is continuing. The emphasis is not on one report, but on a cluster: Challenger job cuts and weak hiring intent,
ADP benchmark revisions that imply weakness began earlier than commonly recognized, and JOLTS dynamics that suggest weakening
labor demand and churn. The market reaction in high-beta areas such as crypto and private credit equities is framed as an early
repricing of that labor reality.
Macro translation: why a cluster matters more than a single print
Any single release can be noisy. Our Strategy places more weight on clusters: multiple indicators that converge on
the same direction across different surveys and methodologies. When layoffs, hiring intent, openings, and revisions
all point the same way, the probability rises that we are seeing a real regime shift rather than statistical volatility.
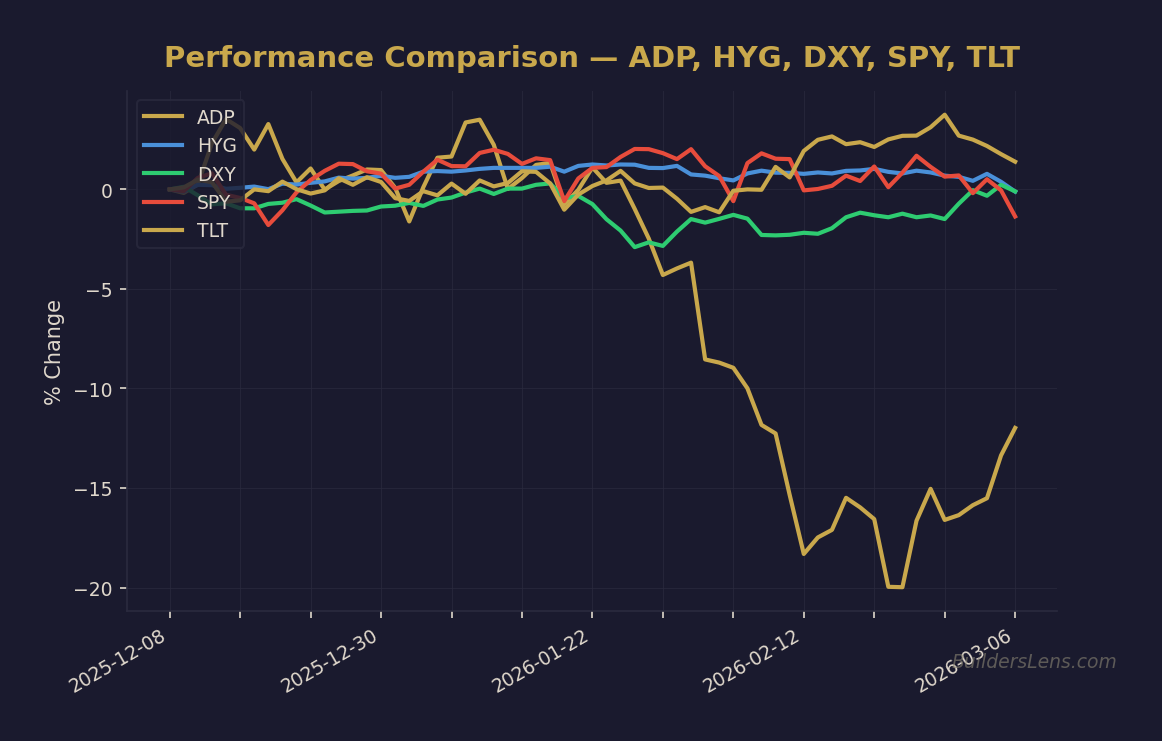
Source: BuildersLens.com Signal Framework | Data as of March 08, 2026
Signal Buckets
- Labor demand: Challenger job cuts and hiring intent, JOLTS openings and turnover, hours worked.
- Labor absorption: Continuing claims as a proxy for unemployment duration and re-hiring speed.
- Credit transmission: Private credit exposure to weakening cash flows and refinancing pressure.
- Liquidity tolerance: High-beta repricing as a diagnostic of falling risk appetite.
- Market internals: Breadth deterioration, leadership concentration, liquidation signatures.
Mechanism: Labor Weakness Transmits in Sequence
Our Strategy treats labor as a lagging confirmer that becomes decisive once the sequence is underway. The critical shift
happens in labor demand before labor pain becomes visible in headlines.
- Openings and hiring intent decline. Firms quietly slow expansion and backfilling.
- Hours worked compress. Income growth weakens even without a sharp unemployment spike.
- Hiring falls below replacement. Churn deteriorates and absorption slows.
- Layoffs and unemployment duration rise. Continuing claims confirm friction.
- Consumption and credit quality weaken. Cash flow stress propagates into spreads.
Why Markets Can Delay Pricing
Liquidity and positioning can temporarily override weakening fundamentals. Narrow leadership can mask internal deterioration.
However, once labor deterioration feeds into credit conditions and funding confidence, repricing becomes more synchronized
across assets.
Phase Mapping and Probabilities
This cluster increases Phase 2 pressure in our framework. Phase 2 is characterized by multiple compression,
fragile leadership, and rising internal stress beneath the surface.
- March through May 2026: Phase 2 continuation 45 to 60 percent. Phase 3 transition 20 to 35 percent.
- June through August 2026: Phase 3 probability increases if labor and spreads confirm deterioration.
- Into early 2027: Sustained labor and credit alignment could shift toward Phase 3 or Phase 4 risk regimes.
What Would Confirm Phase 3 Risk
- Persistent rise in continuing claims.
- Ongoing decline in hours worked.
- Widening credit spreads.
- Tightening lending standards.
- Deteriorating equity breadth.
What Would Invalidate the Downside Path
- Stabilization in job openings and hiring intent.
- Improvement in hours worked.
- Compression in credit spreads without funding stress.
- Broadening equity participation.
What Changes and What Does Not
What changes is our weighting of labor confirmation and credit sensitivity. What does not change is our process.
We do not react to one week of volatility. We do not assume collapse. We let probabilities evolve with confirmation.
Monitoring Dashboard
- Rates: Yield curve shape and real yield direction.
- Credit: High yield and investment grade spreads.
- Liquidity: Dollar funding indicators.
- FX: Broad dollar strength or stress signals.
- Labor: Claims, hours worked, openings trend.
Bottom Line
The labor cluster does not force a single outcome, but it raises Phase 2 pressure and increases sensitivity to credit transmission.
Our Strategy remains confirmation-driven, probability-based, and disciplined in preserving optionality.
Educational disclaimer: This content is for educational purposes only and is not financial advice.
Get the Daily Phase Brief
Signal changes, data releases to watch, and today’s regime assessment — delivered every morning before market open.
Join investors tracking the macro cycle. Unsubscribe anytime.
📊 Run Your Own Analysis
Use the BuildersLens 65-Signal Analyzer for live macro positioning:
→ Analyze HYG (High Yield Credit)
→ Analyze DXY (US Dollar Index)
This article is for educational and informational purposes only and does not constitute investment advice. Past performance is not indicative of future results. Consult with a qualified financial advisor before making investment decisions.