Research · Macro Regime
Liquidity Clusters, Tariffs, and Oil: Late Cycle Pressure Building
Liquidity Clusters, Tariffs, and Oil: Translating the Signal Stack
When liquidity injections begin clustering, tariffs rise, and oil breaks higher simultaneously, the correct response is not prediction. It is classification. Our Strategy focuses on mechanisms over narratives, signals over outcomes, and sequencing over timing. This update translates the recent macro developments into phase pressure and probability mapping.
Signal One: Liquidity Plumbing
Clustered Federal Reserve liquidity injections are not crash signals by default. They are plumbing signals. When reserves are added in bursts, we monitor funding stability, repo conditions, auction behavior, and dealer balance sheet strain. Persistence matters more than magnitude.
Single-day injections can represent temporary settlement friction. Repeated clustering elevates monitoring probability for funding stress transmission.
Source: BuildersLens.com Signal Framework | Data as of March 08, 2026
Signal Two: Tariffs as Margin Compression
Tariffs function as distributed cost shocks. They operate like a broad-based margin tax on consumption and supply chains. Even if nominal activity appears stable, purchasing power flexibility compresses underneath the surface.
This creates late-cycle vulnerability without immediate collapse. The mechanism increases Phase Two compression probability rather than triggering Phase Three credit transmission automatically.
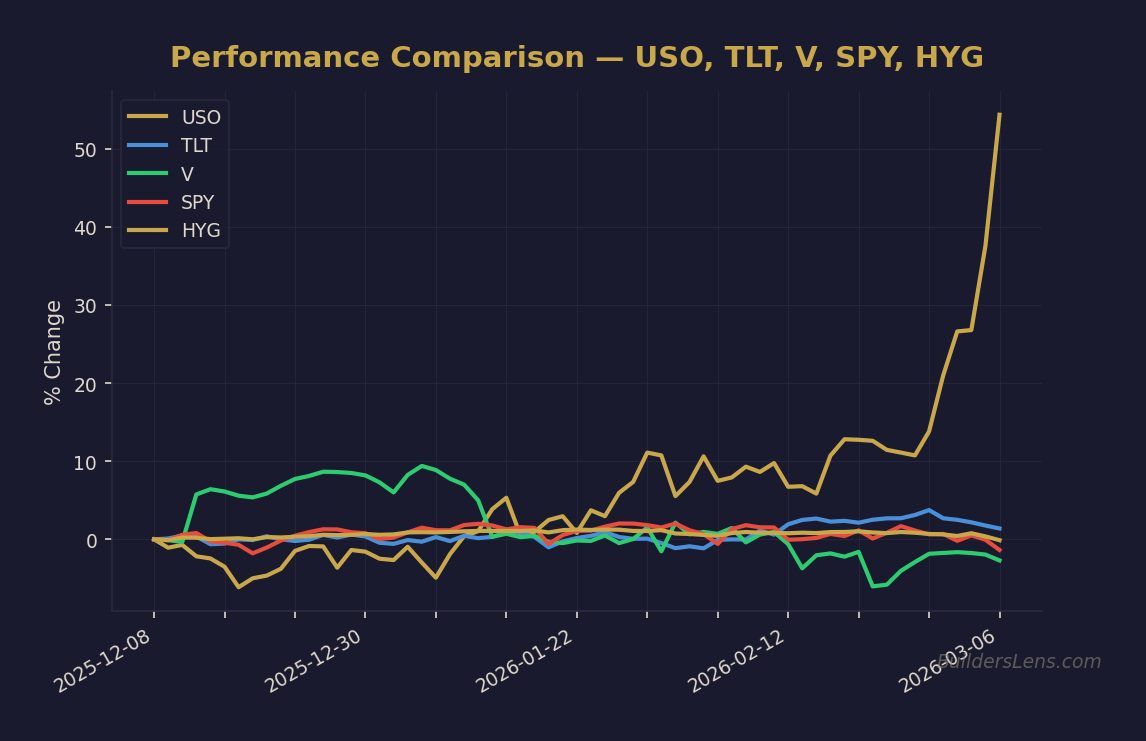
Signal Three: Energy and the Inflation Constraint
Oil strength reintroduces inflation constraint risk. In this configuration, falling yields are not automatically bullish. Yields can decline due to weakening growth expectations while inflation pressure remains structurally sticky.
This is the regime shift risk: when falling yields stop helping equities and instead reflect growth rollover.
Signal Four: Concentrated Leadership
Semiconductors remain a structural backbone of equity leadership. Until concentrated leadership materially breaks, broad index collapse probabilities remain contained. However, narrowing breadth increases Phase Two compression risk.
Leadership persistence does not eliminate risk. It delays transmission.
Phase Probability Mapping
- Late Phase One with Rising Phase Two Pressure: approximately sixty percent probability into mid twenty twenty six. Characterized by rotation, valuation compression, and headline volatility without systemic breakdown.
- Clear Phase Two Compression: approximately thirty to thirty five percent probability into late twenty twenty six if credit spreads widen and breadth deteriorates.
- Phase Three Credit Transmission: approximately twenty percent probability into twenty twenty seven, contingent on sustained funding stress and disorderly credit behavior.
Confirmation Triggers
- Persistent high-yield spread widening
- Weak Treasury auction demand and rising tails
- Repo funding instability beyond isolated injections
- Deteriorating breadth during equity rallies
- Semiconductor leadership failing on positive catalysts
Invalidation Triggers
- Credit spreads remain contained through volatility
- Liquidity accelerates rather than clusters episodically
- Broadening participation across sectors
- Orderly long-duration yield behavior
Structural Takeaway
This environment does not require panic. It requires sequencing discipline. The distinction between compression and transmission defines regime escalation. Until credit confirms deterioration, optionality and flexibility dominate conviction.
The edge is not forecasting outcomes. The edge is recognizing when mechanisms shift phase.
Educational Notice: This material is for educational purposes only and does not constitute financial, investment, legal, or tax advice. Markets involve risk and uncertainty.
For additional regime-based research and macro framework updates, visit BuildersLens.
Supported by V6D.
📊 Run Your Own Analysis
Use the BuildersLens 65-Signal Analyzer to see live macro positioning for tickers mentioned in this article:
→ Analyze TLT (Long-Term Treasuries)
This article is for educational and informational purposes only and does not constitute investment advice. Past performance is not indicative of future results. Consult with a qualified financial advisor before making investment decisions.