Research · Uncategorized
MARKET CONCENTRATION / NARROW BREADTH
Market Concentration & Narrow Breadth
Why Fewer Winners Is Often a Late-Cycle Warning
Markets do not usually fail all at once.
They weaken gradually — often while indexes continue to rise.
One of the clearest signs of this internal weakening
is market concentration,
often described as narrow market breadth.
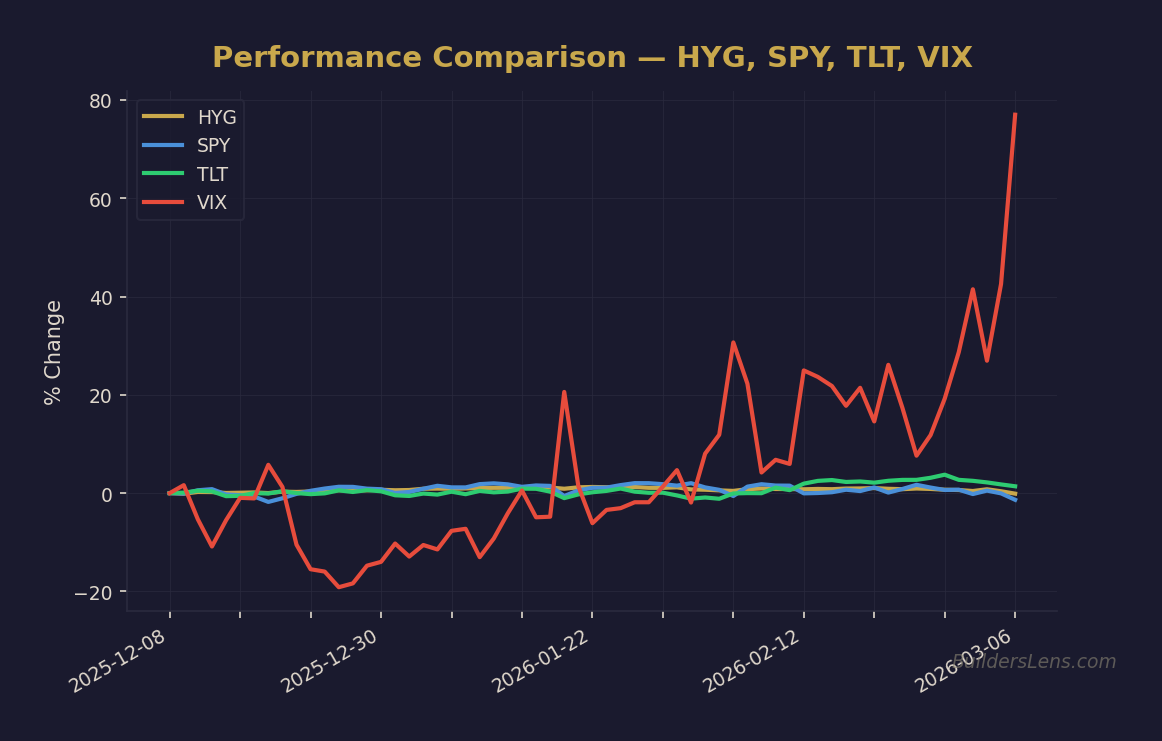
Source: BuildersLens.com Signal Framework | Data as of March 08, 2026
At BuildersLens, we view market concentration
not as a bearish prediction,
but as a signal about where we are in the cycle.
What Is Market Breadth? (Plain English)
Market breadth measures how many stocks
are participating in a market move.
In a healthy market:
- Many stocks rise together
- Leadership is broad
- Gains are well-distributed
In a narrow market:
- A small group of stocks drives index returns
- Most stocks lag or decline
- Leadership becomes concentrated
Indexes can still make new highs —
even while the majority of stocks weaken.
Why Market Concentration Matters
Narrow breadth reflects a subtle but important shift:
Investors become selective rather than confident.
As cycles mature:
- Capital flows toward perceived “safe winners”
- Liquidity becomes selective
- Risk tolerance narrows
This often occurs while headlines remain optimistic
and index-level performance looks strong.
Market concentration is not a crash signal —
it is a fragility signal.
How Narrow Breadth Develops Over a Cycle
Early in expansions:
- Most stocks participate
- Small and mid-caps perform well
- Risk appetite is broad
Late in cycles:
- Leadership concentrates in large, liquid names
- Passive flows amplify winners
- Weaker companies lose access to capital
This transition often happens quietly —
without obvious market stress.
Where Market Concentration Fits in the Five Phases
Phase 0 — Post-Crisis Expansion
In Phase 0:
- Market participation is broad
- Leadership rotates frequently
- Breadth supports price gains
Concentration risk is low.
Phase 1 — Melt-Up / Liquidity Illusion
Phase 1 is where market concentration emerges.
In this phase:
- Indexes rise
- Leadership narrows
- Capital crowds into dominant themes or mega-cap names
This creates the illusion of strength —
even as internal participation deteriorates.
Phase 2 — Crack Formation / Rolling Stress
In Phase 2:
- Narrow breadth becomes persistent
- Former leaders begin to stall
- Rotation fails to re-broaden participation
This is often when:
Good news stops producing higher prices.
Phase 3 — Forced Liquidation
In Phase 3:
- Leadership breaks down
- Correlations rise
- Diversification fails
Concentration no longer provides protection —
it becomes a source of vulnerability.
Phase 4 — Reset / Accumulation
In Phase 4:
- New leadership begins to emerge
- Breadth slowly improves
- Opportunity expands beyond a few names
This is where broad participation returns.
Where We Are Today
In the current environment, market concentration
has reached historically high levels.
Common characteristics include:
- A small number of mega-cap stocks driving index returns
- Weak participation beneath the surface
- Dependence on a narrow set of narratives
In Five Phases terms:
This aligns with late Phase 1 transitioning into Phase 2 —
where leadership narrows as liquidity becomes selective.
This does not mean an immediate downturn.
It means resilience is thinner than it appears.
What Market Breadth Can — and Cannot — Tell Us
Market breadth helps answer:
How many assets are actually supporting the trend?
It cannot:
- Time market tops
- Override credit signals
- Predict catalysts
It is a diagnostic tool —
not a trigger.
Final Takeaway
Market concentration is often mistaken for strength.
- Fewer winners can still push indexes higher
- Narrow breadth increases fragility
- Leadership concentration is a late-cycle feature
Within the Five Phases framework,
narrow breadth is not a reason to panic —
but it is a reason to pay attention.
When fewer stocks hold the market up,
the system becomes easier to destabilize.
Get the Daily Phase Brief
Signal changes, data releases to watch, and today’s regime assessment — delivered every morning before market open.
Join investors tracking the macro cycle. Unsubscribe anytime.
📊 Run Your Own Analysis
Use the BuildersLens 65-Signal Analyzer for live macro positioning:
→ Analyze HYG (High Yield Credit)
This article is for educational and informational purposes only and does not constitute investment advice. Past performance is not indicative of future results. Consult with a qualified financial advisor before making investment decisions.