Research · Market Internals
Markets Are Holding Up — But This Late Cycle Signal Is Cracking
Markets can look calm — even rallying — while structural risk builds quietly underneath. In this episode of Independent by Design — The Builders Lens, we translate a specific technical warning into Our Strategy’s five-phase macro framework, showing why failed breakouts only matter conditionally, how rotation can mask stress, and what would truly confirm a shift into Phase Two.
Source: BuildersLens.com Signal Framework | Data as of March 08, 2026
Quick Disclaimer
This content is for educational and informational purposes only and reflects Our Strategy’s sequence-based approach to macro analysis. It is not financial advice.
Source Video Reviewed
Markets Are Holding Up — But This Late Cycle Signal Is Cracking
Original video referenced in the episode:
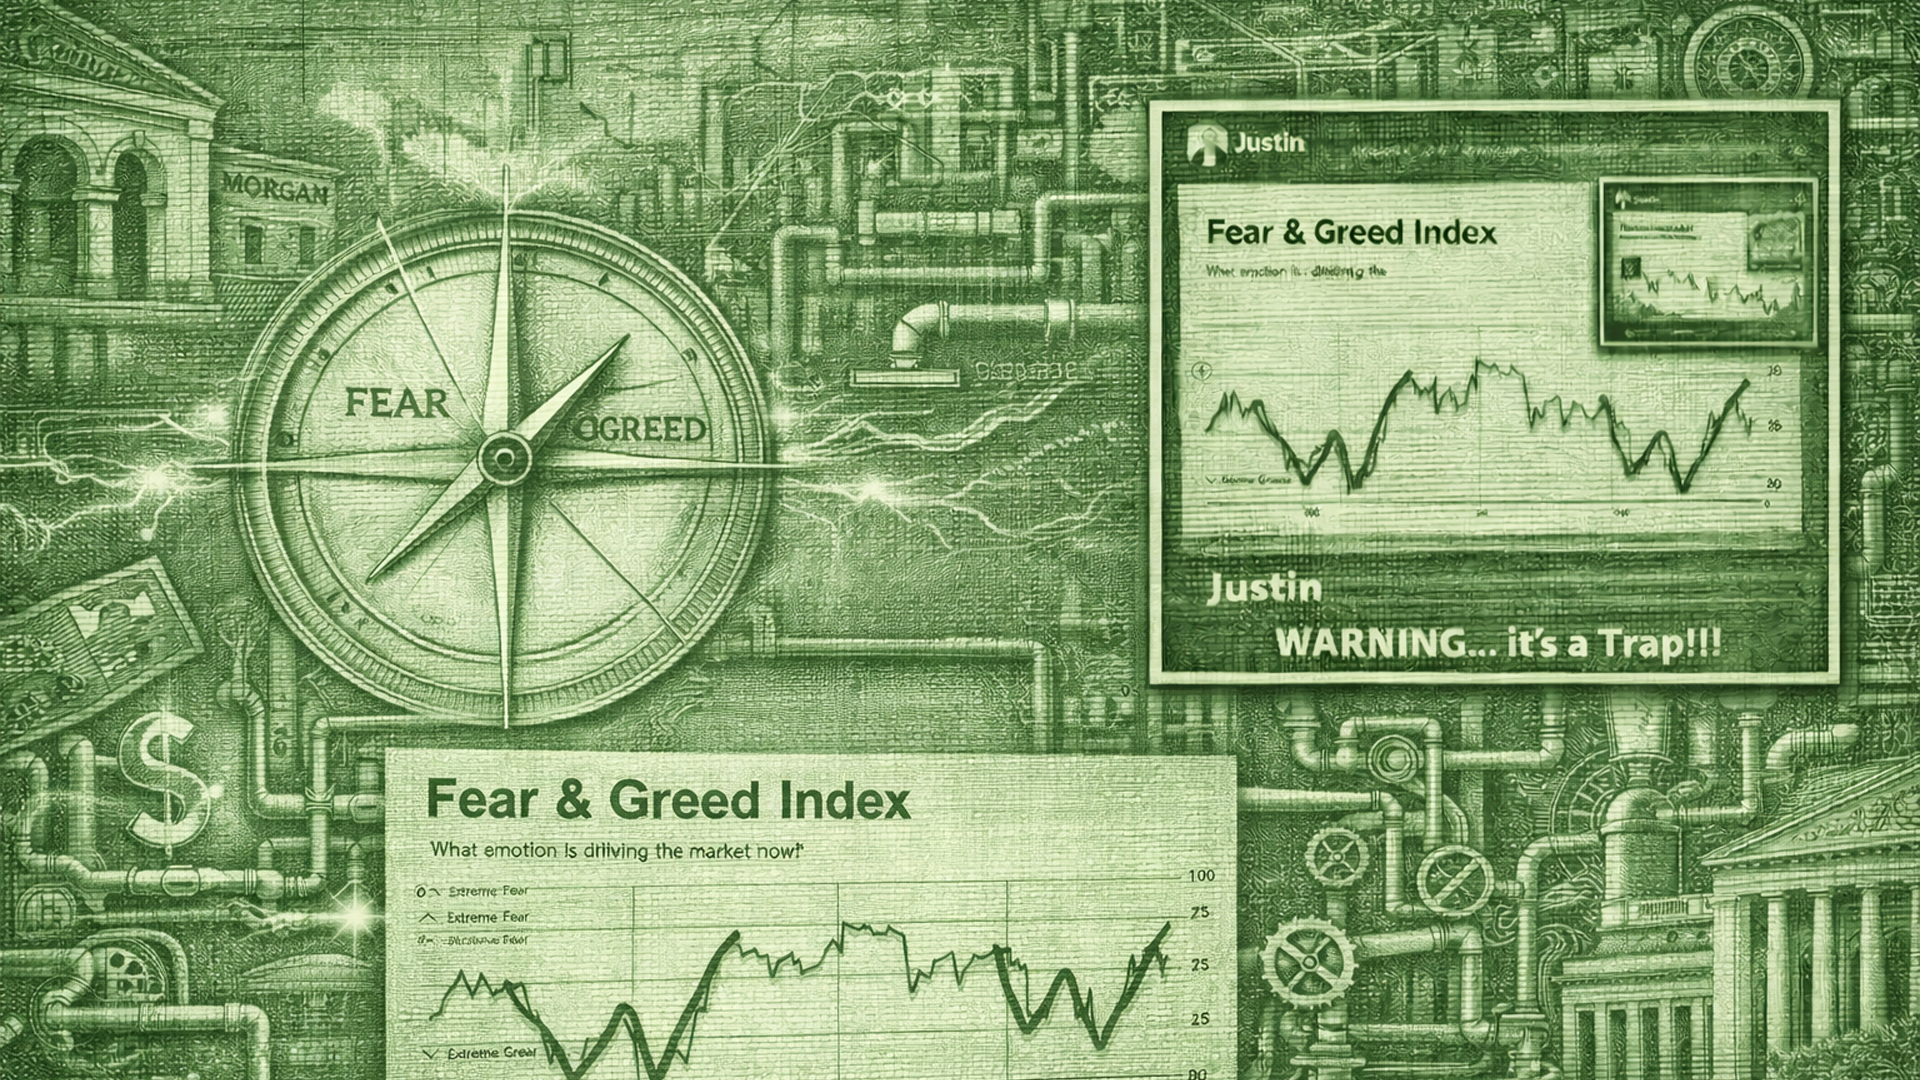
WARNING… it’s a Trap!!!
Why Failed Breakouts Matter — But Only Conditionally
Technical patterns such as failed breakouts can be tempting to interpret as broad market warnings — but they only matter if they line up with underlying mechanics. Markets can technically “fail” resistance levels while liquidity conditions remain supportive and credit markets stay firm.
Plain-English causality: A failed breakout is just a price pattern — but when liquidity, credit, or funding behavior corroborates it, that’s when it becomes meaningful.
Rotation Masks Fragility
Late in market cycles, leadership can rotate — for example, from mega-caps to cyclicals or from technology to small caps — without actually resolving the structural risk underneath.
Rotation can create the appearance of participation and breadth even when core mechanics are weakening.
Mechanics vs Patterns
Our Strategy emphasizes that downturns are caused by liquidity and credit forces, not by chart patterns alone. A pattern can be suggestive, but it has to be backed by something deeper — such as widening credit spreads, tightening funding, or a real shift in risk appetite.
Where This Signal Fits in the Phase Framework
According to the signal discussed in the episode, this indicator aligns with late Phase 1 behavior — meaning it nudges the probability of Phase Two higher, but does not by itself confirm a transition to forced selling or systemic stress.
Key Signals to Watch Over Time
- Equity participation breadth: If leadership breaks together instead of rotating.
- Credit spreads: Widening spreads are a stronger signal of stress than price action alone.
- Funding indicators: Such as repo rates, dealer balance sheets, or term premium behavior.
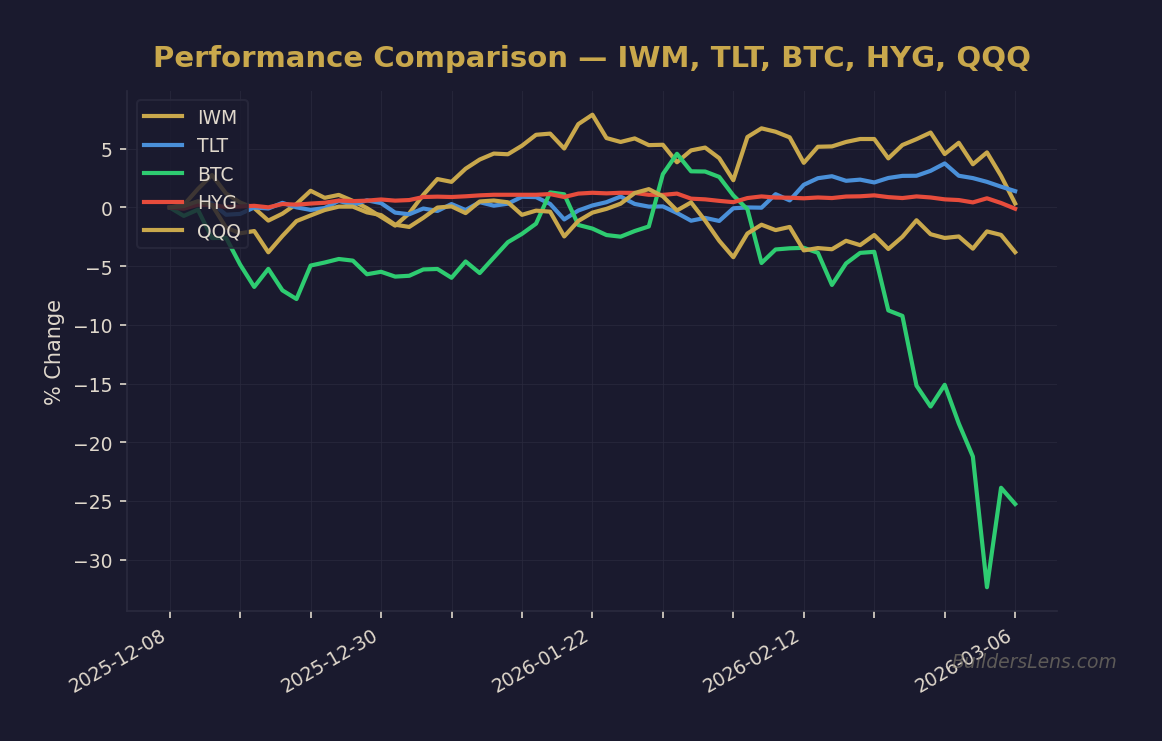
- Long duration assets: Like TLT or ZROZ for bond market risk dynamics.
- Liquidity sensitive risk assets: Including Bitcoin and other high-beta instruments.
Phase Mapping (Our Strategy)
Below is a simplified look at how this signal affects phase probabilities. This is a process view, not a forecast:
| Horizon | Phase 1 (Fragile Stability) | Phase 2 (Rising Stress) | Phase 3 (Forced Repricing) | Next Confirm Trigger |
|---|---|---|---|---|
| 3 months | High | Low–Moderate | Low | Credit spreads and funding signals |
| 6 months | Moderate | Moderate | Low | Breadth breakdown and spread widening |
| 9 months | Lower if conditions stress | Higher if spreads widen | Moderate | Refinancing warning and liquidity tightening |
| 12 months | Lower | Moderate–High | Moderate | Funding market disruption |
Who This Hits First
- Leveraged investors: More sensitive to tightening funding conditions.
- Equity sectors dependent on debt: Such as small caps or highly cyclical stocks.
- Credit-sensitive assets: High yield and credit ETFs if spreads widen.
Process Notes (Not Trade Advice)
- Separate mechanical risk signals from price pattern narratives.
- Cart before the horse: patterns can mislead without liquidity context.
- Focus on spreads, funding, and cross-asset stress transmissions for confirmation.
- Maintain optionality — avoid conviction without multiple signal confirmations.
Close
A failed breakout can be interesting — but it’s not important until underlying funding, credit, or breadth conditions confirm stress. Markets can appear strong even as asymmetry rises; the real question is whether the plumbing breaks before the pattern does.
Background logic generated via structured macro process
Get the Daily Phase Brief
Signal changes, data releases to watch, and today’s regime assessment — delivered every morning before market open.
Join investors tracking the macro cycle. Unsubscribe anytime.
📊 Run Your Own Analysis
Use the BuildersLens 65-Signal Analyzer for live macro positioning:
→ Analyze HYG (High Yield Credit)
This article is for educational and informational purposes only and does not constitute investment advice. Past performance is not indicative of future results. Consult with a qualified financial advisor before making investment decisions.