Research · Market Internals
Markets Are Up, But Chart Structure Signals Late Cycle Risk
Markets can be up while structure quietly deteriorates underneath. In this episode of
Independent by Design — The Builders Lens, we translate Gareth Soloway’s
technical warning signals into Our Strategy five-phase framework—focusing on
sequencing, probabilities, and what would confirm a real phase transition.
Source: BuildersLens.com Signal Framework | Data as of March 08, 2026
Quick Disclaimer
This content is for educational purposes only and reflects Our Strategy’s probability- and
sequencing-based macro framework. It is not financial advice.
Watch the Episode
Markets Are Up, But Chart Structure Signals Late Cycle Risk
Original Video Reviewed
Gareth Soloway (Live) — technical warning signals (full context)
Why Repeated Trendline Tests Matter (Conditionally)
A trendline isn’t “support” because it’s drawn on a chart. It becomes support because enough
positioning and behavior clusters around it. The issue is that repeated tests tend to weaken
that behavior. Each retest is another opportunity for liquidity to thin, stops to stack,
and buyers to demand a better price.
In Our Strategy, that’s not a crash call—it’s a risk-density signal:
the market can still grind higher, but the downside asymmetry increases if the
line finally breaks in a poor liquidity window.
Mega-Cap and Banks Cracking Beneath Index Strength
Late cycle often looks like this: the index stays firm, while key transmission groups begin to
wobble. This episode highlights how mega-cap leadership narrowing and
bank weakness can show up before headlines change.
- Narrowing leadership raises fragility because fewer names are holding up the tape.
- Banks matter because they sit on the credit and liquidity transmission chain.
- When both weaken together, Phase 1 can persist—but Phase 2 sensitivity rises.
Yields and Liquidity: The Constraint Layer
The episode notes the 10-year yield in a longer consolidation. In Our Strategy,
that’s a key “constraint” variable: the eventual resolution matters for duration-sensitive equity
valuations, housing transmission, and broader risk appetite.
The signal is not “yields up = crash.” The signal is: if yields break higher while leadership narrows,
the market’s ability to absorb shocks declines, and the timing window can compress.
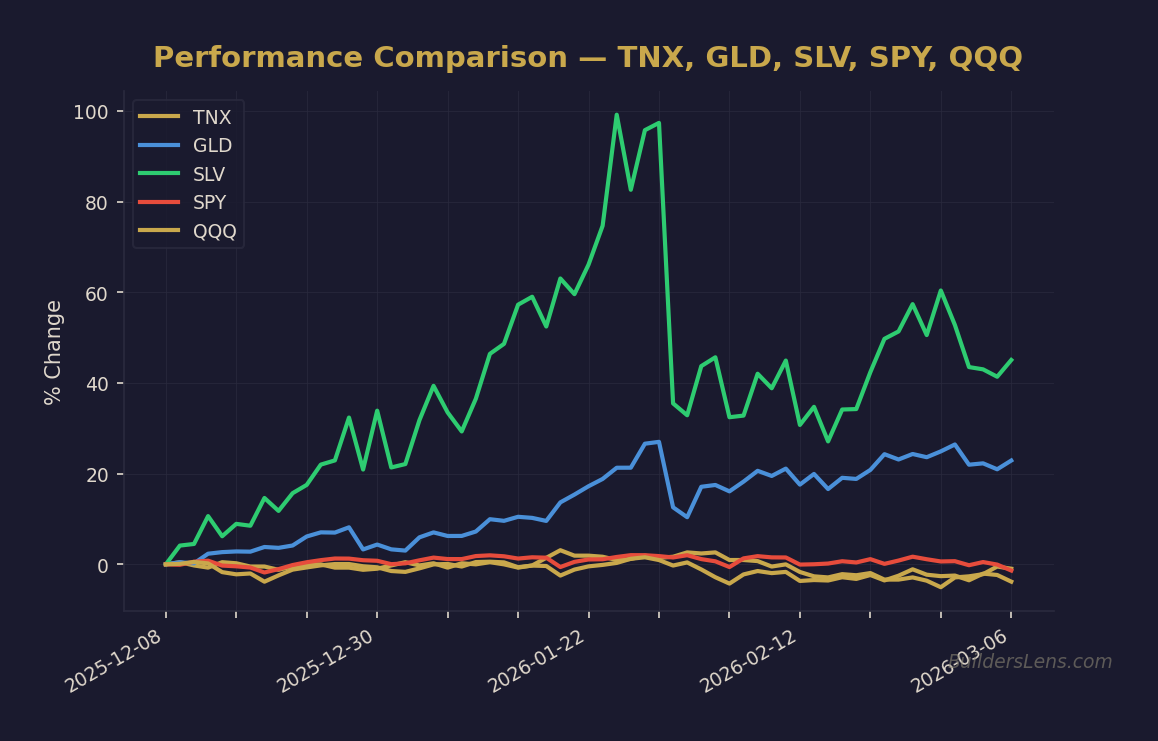
Gold and Silver: Strong Long-Term, But Watch Short-Term Momentum
Gold and silver can remain structurally strong even while their short-term momentum fades. Our Strategy
treats this as a regime nuance: the long-term thesis can hold, but near-term positioning and liquidity
can still create sharp moves both directions.
Phase Mapping: Phase 1 vs Phase 2
This episode aligns with late Phase 1: markets can still hold up and grind, but structure
is weakening and risk density rises.
- Phase 1 behavior: index strength persists, rotation masks fragility, liquidity still supports.
- Phase 2 pressure: increases if leadership breaks together, banks continue rolling, and yields/liquidity tighten.
What Changes (Our Strategy)
- Tighten exit discipline near repeated resistance / trendline tests
- Reduce aggression buying into “obvious” structure
- Move yields + banks + leadership higher in the signal stack
What Does Not Change
- No crash predictions from charts alone
- Phase transitions require confirmation (credit/funding/volatility response)
- Tranche discipline stays non-negotiable
Monitoring Watchlist (Not Recommendations)
These instruments are useful for tracking structure, leadership, rates sensitivity, and stress
transmission:
- Index / beta: SPY, QQQ
- Leadership / concentration: SMH
- Banks / credit transmission: XLF, KRE
- Rates / duration constraint: TLT, ZROZ
- Real-asset stress gauges: Gold, Silver
Takeaway
When price is strong but structure is repeatedly tested, Our Strategy treats it as a
late-cycle risk signal: not a reason to panic, but a reason to tighten rules.
The market’s “look” can stay bullish—right up until a liquidity window turns a break into a fast move.
Educational macro framing only. Not financial advice.
Get the Daily Phase Brief
Signal changes, data releases to watch, and today’s regime assessment — delivered every morning before market open.
Join investors tracking the macro cycle. Unsubscribe anytime.
📊 Run Your Own Analysis
Use the BuildersLens 65-Signal Analyzer for live macro positioning:
This article is for educational and informational purposes only and does not constitute investment advice. Past performance is not indicative of future results. Consult with a qualified financial advisor before making investment decisions.