Research · Credit & Liquidity
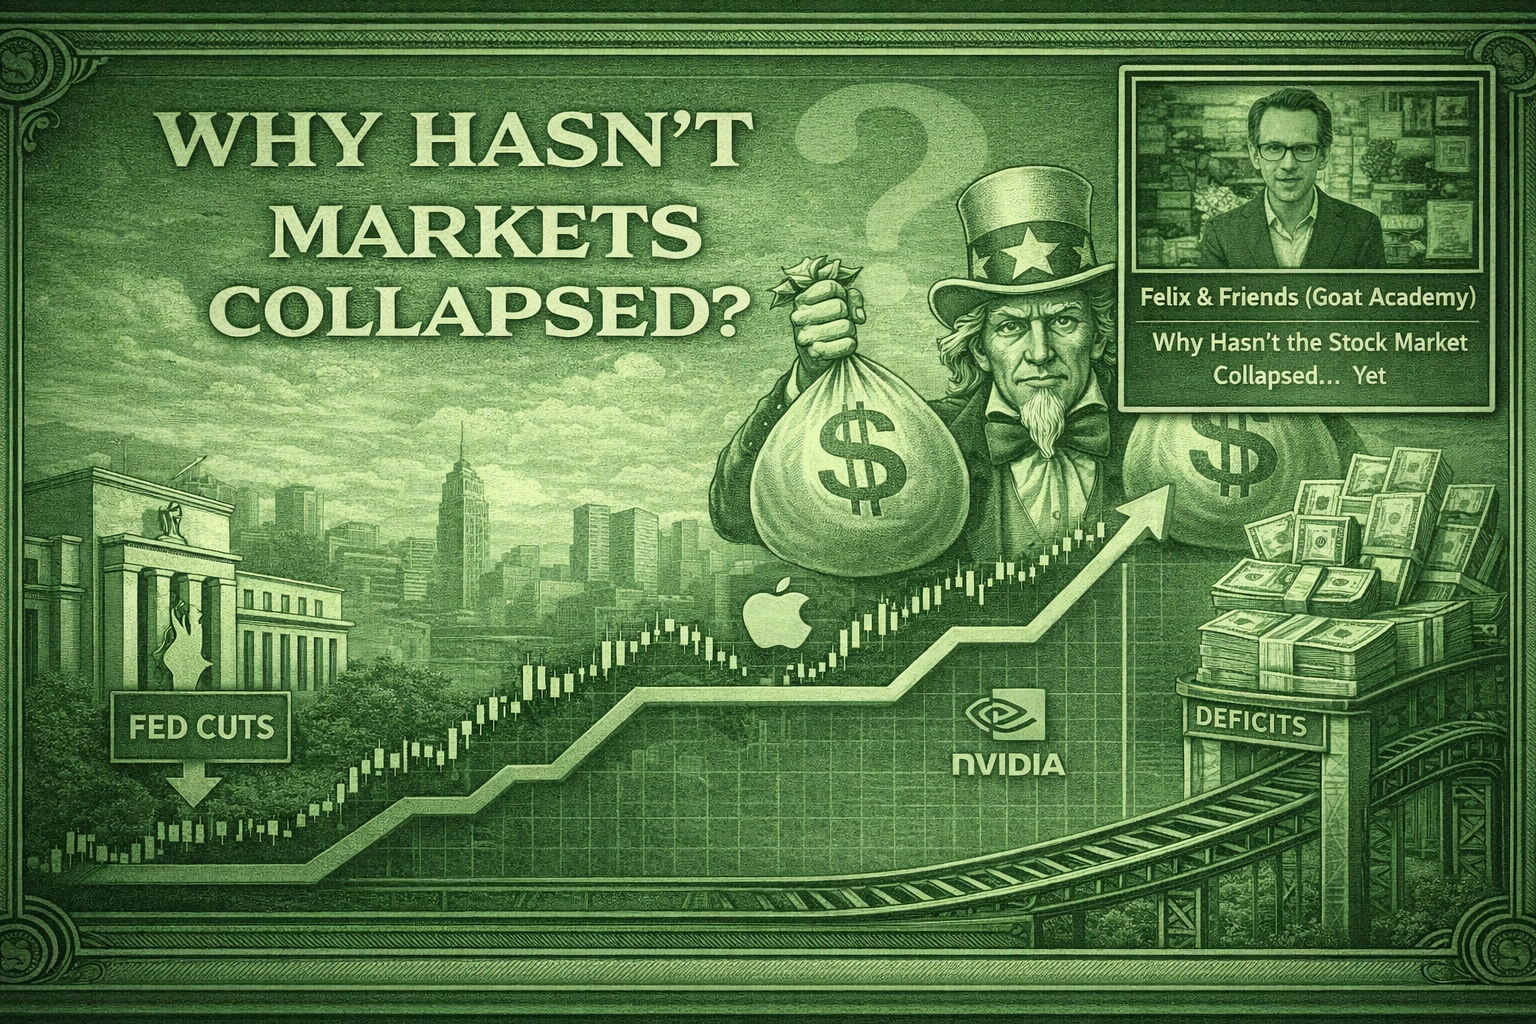
Markets Hit Highs as Jobs Weaken: A Late-Cycle Signal
Markets Hit Highs as Jobs Weaken: A Late-Cycle Signal
In Our Strategy, we do not try to predict the next headline. We sequence risk through
signals—liquidity, credit, labor transmission, and market structure. Late in cycles,
these signals often diverge. Markets can remain elevated even as the real economy
softens beneath the surface.
That divergence is not unusual. What matters is how long it can persist
and what ultimately forces resolution.
What the Source Video Is Actually Claiming
The source video highlights a late-cycle tension: equity markets near highs while
labor indicators weaken. The explanation centers on three supports that can delay
repricing:
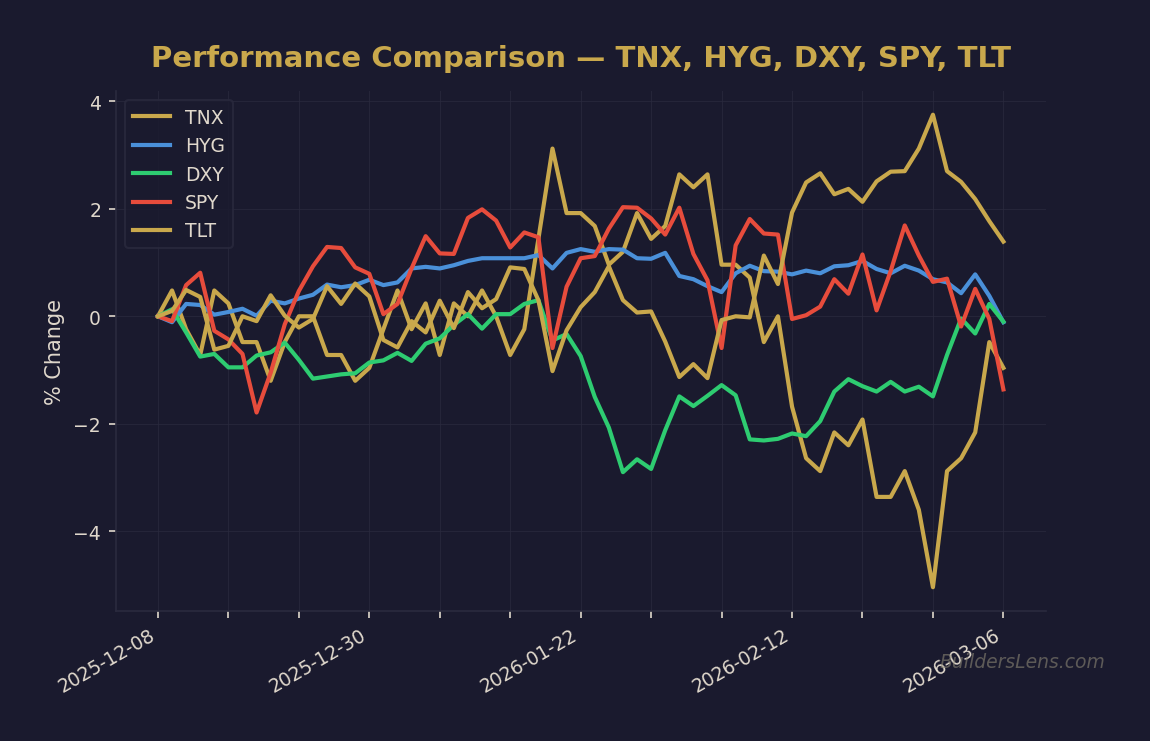
Source: BuildersLens.com Signal Framework | Data as of March 08, 2026
- Easier policy and expected rate cuts lifting valuations
- Extreme index concentration, with a small group of mega-cap stocks carrying returns
- Large fiscal deficits supporting revenue and nominal growth
These forces help explain why Phase 1 conditions can persist even as fragility builds.
They are not timing tools. They are structural supports.
Signal Classification Within Our Strategy
- Liquidity: Policy easing supporting asset prices faster than the economy
- Labor: Weakening employment as a lagging confirmation signal
- Credit: Still contained, but critical for phase transition
- Market structure: Narrow breadth sustaining index levels
This is a late Phase 1 divergence signal, not a forced-liquidity trigger.
The Mechanism: Why Markets Can Rise as Jobs Weaken
Late in cycles, policy acts first on asset prices, not employment. Rate cuts and
liquidity expectations lower discount rates immediately, lifting valuations even
as underlying activity slows.
Labor weakness typically transmits later:
- Employment softens after growth slows
- Defaults and earnings pressure arrive after labor weakens
- Credit stress, not job data, usually forces repricing
As long as credit remains functional and liquidity is available, markets can tolerate
weak labor data longer than expected.
Phase Mapping: Where This Fits in the Cycle
Within Our Strategy framework, this setup aligns with
late Phase 1: Melt-Up With Rising Fragility.
Labor weakness alone does not end Phase 1. Phase transitions typically occur when
labor deterioration transmits into credit stress, funding pressure, or
earnings downgrades.
Probability & Timeline Assessment (Non-Predictive)
-
Phase 1 continuation:
~55–65% probability through mid-2026, supported by liquidity and market structure. -
Transition toward Phase 2 conditions:
~25–35% probability by December 2026 if labor weakness feeds into credit or funding stress. -
Phase 3 policy-dominant environment:
~15–25% probability by June 2027, conditional on tightening financial conditions.
Timing remains conditional. Labor weakness increases fragility, but credit determines
sequencing.
What Changes in Our Strategy
- Tighter exit discipline around crowded leadership and narrow breadth
- Greater emphasis on confirmation from credit and volatility regimes
- Higher value placed on optionality when policy masks deterioration
What Does Not Change
- No all-in decisions; deployment remains tranche-based
- No conversion of late-cycle tension into crash predictions
- No reliance on a single indicator as determinative
- No abandonment of participation solely due to labor headlines
Signals We Continue to Monitor
- Yield direction across the 2Y, 10Y, and 30Y
- Credit spreads between high yield and investment grade
- Dollar strength and global funding conditions
- Equity breadth and concentration measures
- Volatility level and term structure behavior
Invalidation Conditions
- Sustained credit spread compression alongside broadening participation
- Reacceleration in labor demand without policy distortion
- Liquidity tightening without compensating fiscal or policy response
Source
This article is for educational and informational purposes only. It reflects a
probability-based analytical framework and does not constitute investment advice
or recommendations.
Get the Daily Phase Brief
Signal changes, data releases to watch, and today’s regime assessment — delivered every morning before market open.
Join investors tracking the macro cycle. Unsubscribe anytime.
📊 Run Your Own Analysis
Use the BuildersLens 65-Signal Analyzer for live macro positioning:
→ Analyze HYG (High Yield Credit)
→ Analyze DXY (US Dollar Index)