Research · Macro Regime
Markets Look Strong, But This Corporate Cash Wave Changes the Risk
Markets appear resilient — but a major corporate cash flow narrative is quietly reshaping
late-cycle risk. In this episode of Independent by Design — The Builders Lens,
we break down the claim that trillions of dollars are returning to the U.S. through corporate
repatriation, and why the deployment of that cash matters more than the headline itself.
Source: BuildersLens.com Signal Framework | Data as of March 08, 2026
Quick Disclaimer
This content is for educational purposes only and reflects Our Strategy’s
probability- and sequencing-based macro framework. It is not financial advice.
Source Video Reviewed
Markets Look Strong, But This Corporate Cash Wave Changes the Risk
Original video referenced:
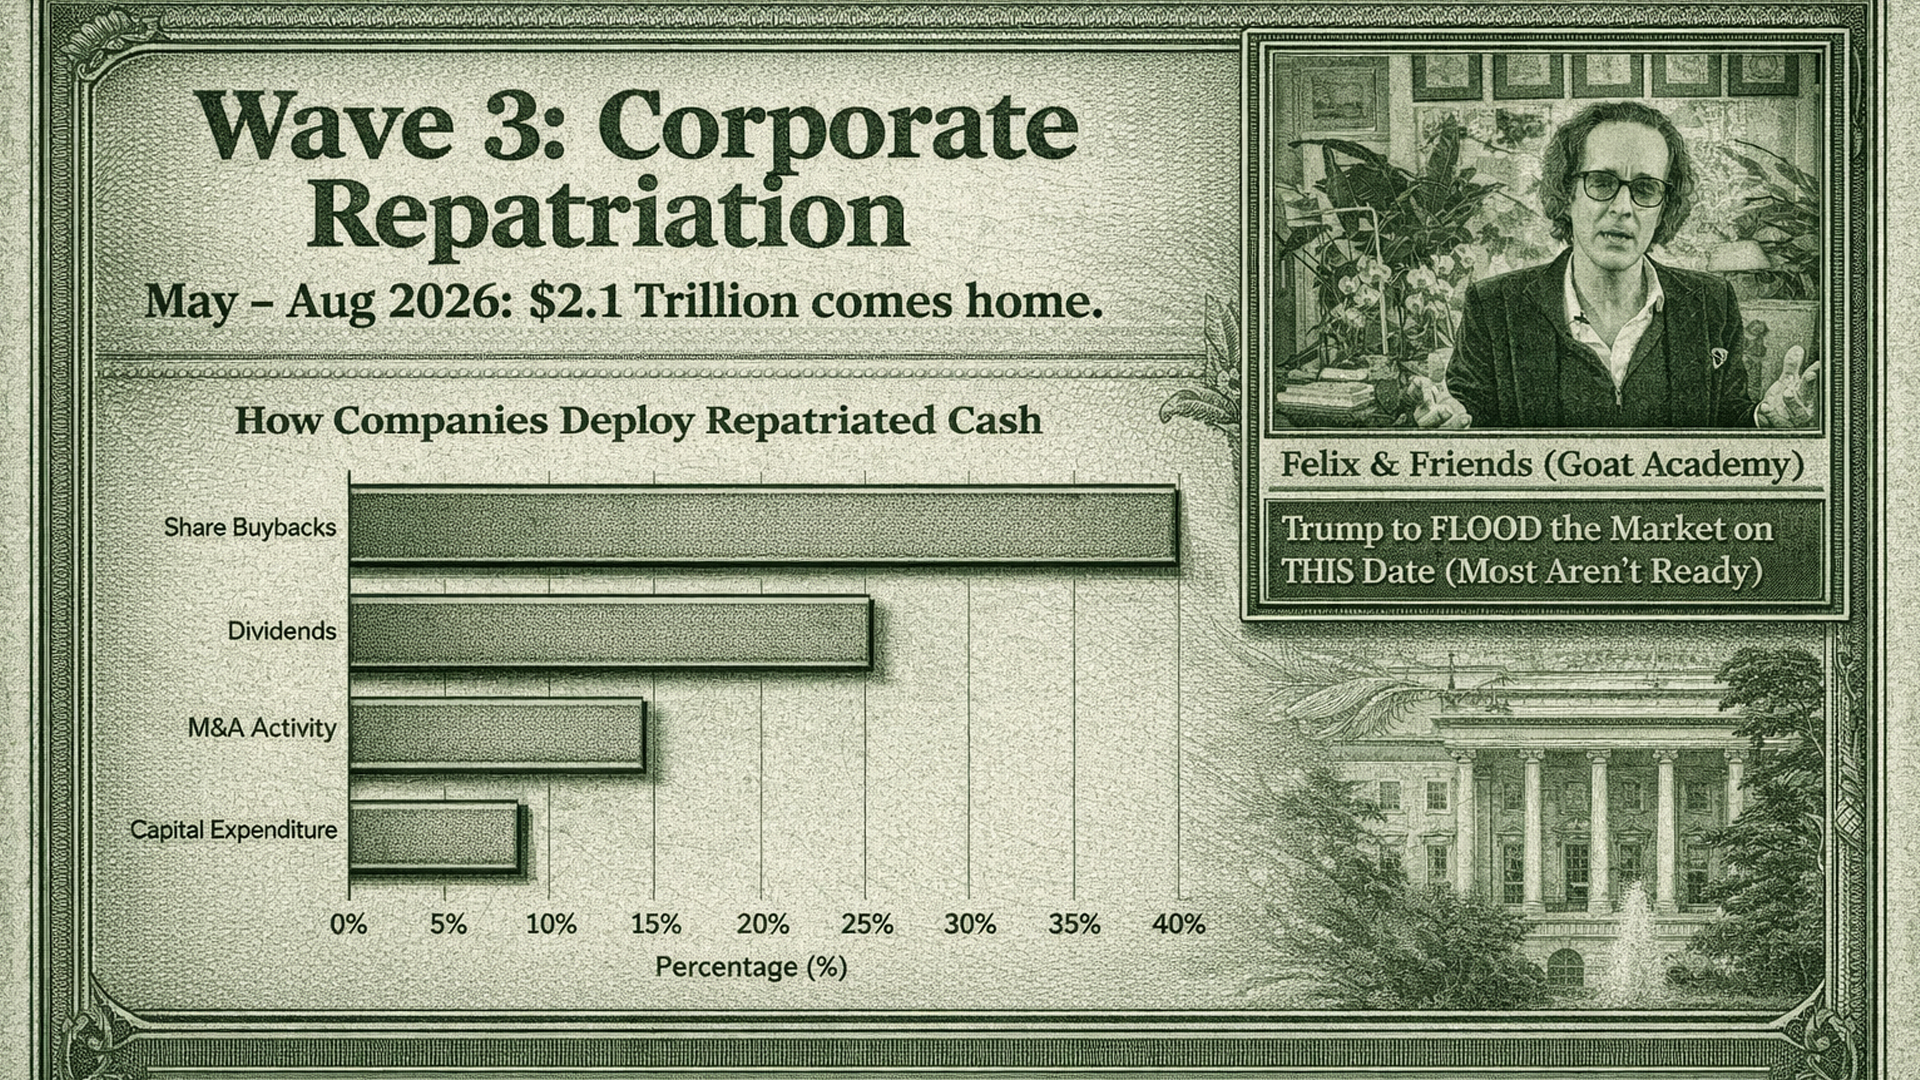
Trump to FLOOD the Market on THIS Date
The Corporate Repatriation Narrative — What Actually Matters
The debate is not whether cash returns to the United States. That part is largely mechanical.
The real risk — and the real signal — is how that capital is used once it arrives.
Historically, repatriated cash is deployed in the following order:
- Share buybacks (primary driver of equity price support)
- Dividends (stabilize passive and income-focused flows)
- Mergers & acquisitions (often late-cycle and valuation sensitive)
- Capital investment (typically the smallest allocation)
Why This Is a Price Support Story — Not a Growth Surge
Buybacks and dividends reduce equity supply and support index levels, but they do not
materially expand productive capacity. This creates a dynamic where prices can rise
even as underlying economic growth remains constrained.
That distinction matters late in the cycle. Payout-driven rallies depend heavily on
cooperative interest rates and stable funding conditions.
Wave Three in the Capital Flow Cycle
In the Curtis Fornera framework, this represents Wave Three — a phase where
cash flows support asset prices mechanically while increasing structural fragility beneath
the surface.
In Our Strategy’s five-phase framework, this wave:
- Supports Phase One continuation in the short term
- Raises Phase Two sensitivity over time
- Increases dependence on long-term rate stability
The Critical Constraint: Long-Term Rates
The success or failure of this wave hinges on one variable: long-term yields.
If equities rise while long yields remain contained, buybacks retain their protective power.
If yields rise alongside equities, term premium overwhelms payout support and fragility
accelerates.
Confirmation Signals to Watch
- Acceleration in corporate buyback authorizations
- Rising dividend guidance
- Equity strength with contained long-duration yields
- Stable credit spreads
Conditions That Weaken the Wave
- Rising long yields with flat or narrowing earnings expectations
- Buyback activity failing to accelerate
- Credit spreads widening beneath stable index prices
- Narrowing market leadership
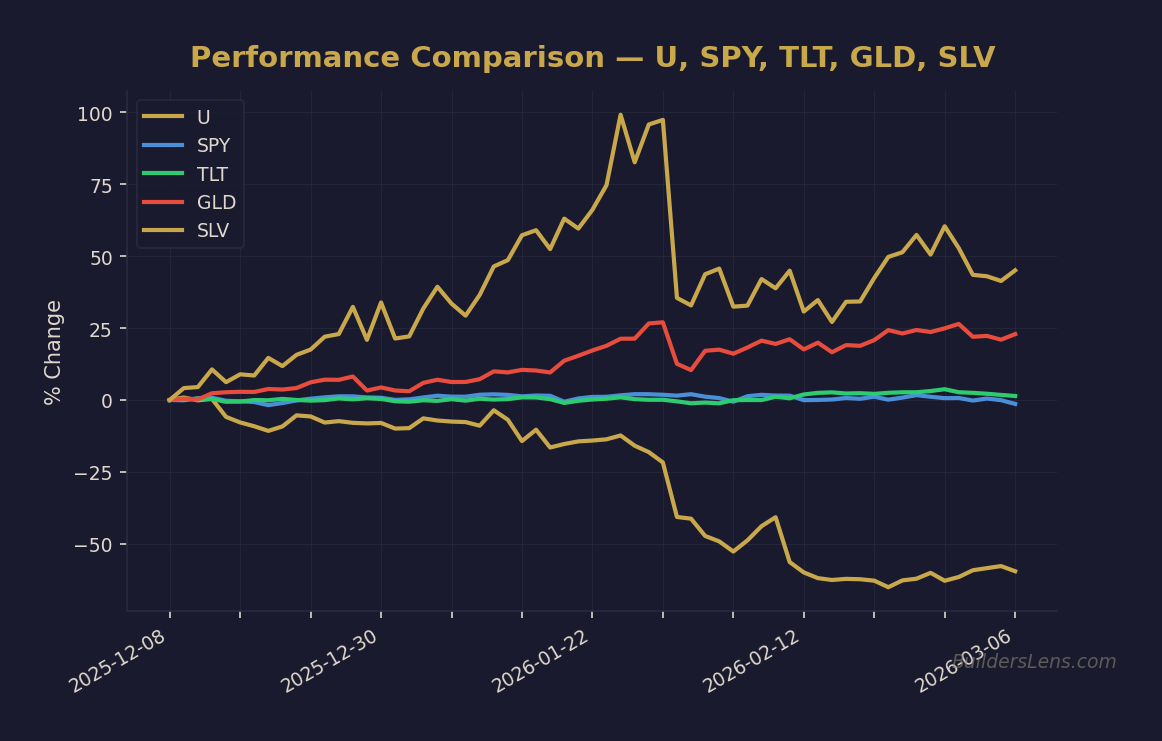
Ticker Sensitivity (Monitoring Only)
These are not recommendations. They represent assets most sensitive if this
wave persists or fails:
- Equities: SPY, SMH, AIQ, CHAT
- Rates / Duration: TLT, ZROZ
- Late-cycle hedges: Gold, Silver
- Real-economy pressure: Oil
- Liquidity regime signal: Bitcoin
Strategy Takeaway
This corporate cash wave can support markets in the short term — while quietly increasing
late-cycle fragility underneath.
The real signal is not the cash itself.
The real signal is whether long-term rates allow the market to keep it.
Generated using a signal-first macro framework focused on probabilities, sequencing,
and disciplined risk management.
Get the Daily Phase Brief
Signal changes, data releases to watch, and today’s regime assessment — delivered every morning before market open.
Join investors tracking the macro cycle. Unsubscribe anytime.
📊 Run Your Own Analysis
Use the BuildersLens 65-Signal Analyzer for live macro positioning:
This article is for educational and informational purposes only and does not constitute investment advice. Past performance is not indicative of future results. Consult with a qualified financial advisor before making investment decisions.