Research · Cycle Sequencing & Phases
Migration Is Slowing — Housing Still Falling

Migration Headlines vs. Housing Mechanisms
Recent U-Haul migration data suggests continued inbound movement into Texas, Florida, and other Sunbelt states. At face value, that appears supportive for housing demand. However, within Our Strategy’s probability-based framework, direction alone does not determine pricing outcomes. The mechanism that matters is net absorption relative to supply under prevailing financing conditions.
Migration is a flow variable. Housing prices are a balance sheet outcome. What drives pricing is whether incremental buyers can clear incremental inventory at current monthly payments. When affordability compresses while supply expands, prices adjust—even if population growth remains positive.
Phase Classification: Where Housing Sits Now
Within Our Strategy’s five-phase framework, national housing conditions most closely align with Phase Two: Multiple Compression. This phase is characterized by repricing driven by affordability constraints rather than forced liquidation.
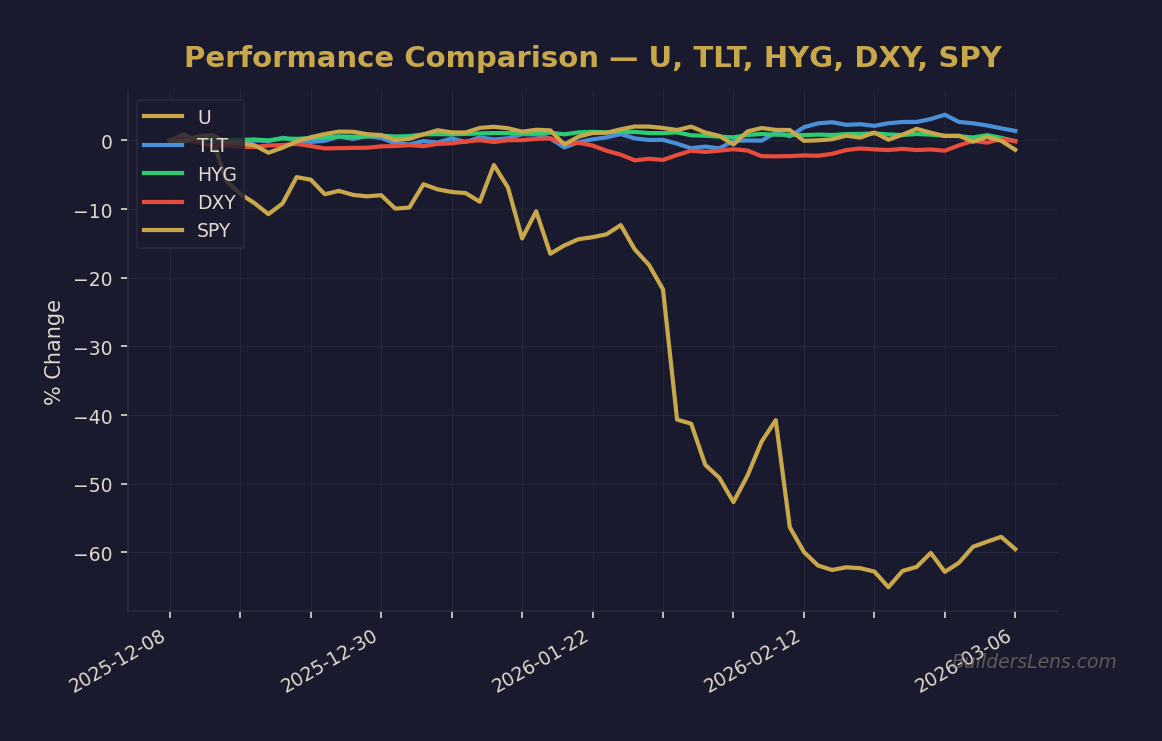
Source: BuildersLens.com Signal Framework | Data as of March 08, 2026
- Current Phase Probability (through December 2026): Approximately sixty percent probability of continued Phase Two compression.
- Next Phase (Stabilization by June 2027): Approximately thirty percent probability of earlier stabilization if real mortgage rates ease and inventory tightens.
- Downside Phase Three Risk (by mid 2027): Approximately ten percent probability of broader stress if labor conditions deteriorate and credit spreads widen materially.
The Three Transmission Filters
1. Magnitude of Migration
Inbound movement remains positive in many Sunbelt markets, but the magnitude has slowed significantly relative to twenty twenty one and twenty twenty two. Direction is unchanged. Intensity is not.
2. Inventory Expansion
High elasticity supply regions built aggressively during the surge years. When migration slowed from extreme to moderate, supply did not instantly contract. That sequencing lag is critical.
3. Cost of Capital and Insurance
Mortgage rates, property taxes, and rising insurance premiums are functioning as tightening mechanisms. Even without additional policy hikes, all-in monthly affordability remains constrained.
Geographic Concentration and Reset Zones
The southern corridor—Texas through Louisiana into Georgia and Florida—has experienced the most visible repricing. Markets like Austin, Dallas, and parts of Florida show inventory expansion alongside price declines. In Louisiana, specific neighborhoods now trade below pre-pandemic levels after significant resets tied to insurance costs.
This reflects sequencing, not demographic collapse. Affordability resets before demand stabilizes.
What Changes vs. What Does Not
What Has Changed
- Migration intensity has slowed relative to pandemic surge levels.
- Inventory levels have expanded across multiple Sunbelt metros.
- Insurance costs have become a meaningful structural variable.
What Has Not Changed
- Demographic direction remains broadly southbound.
- Long-term population growth trends remain intact.
- Housing remains highly sensitive to rate and term premium dynamics.
Multi-Asset Monitoring Dashboard
Housing does not operate in isolation. We monitor cross-asset signals that influence affordability and stress transmission:
- Rates: Ten-year Treasury yield, mortgage rate spreads.
- Credit: High yield spreads, bank lending standards.
- Liquidity: Treasury issuance dynamics, funding stress indicators.
- Foreign Exchange: Dollar strength as tightening proxy.
- Market Internals: Regional bank equities as early stress barometer.
Confirmation and Invalidation Signals
Confirmation of Stabilization
- Sustained decline in active listings.
- Rental vacancy rates flattening and tightening.
- Insurance premium growth moderating.
- Long-term yields easing without term premium expansion.
Invalidation of Stabilization Thesis
- Inventory rising alongside labor deterioration.
- Accelerating delinquencies, particularly FHA exposure.
- Long-term yields rising due to funding stress or auction weakness.
Signal Confidence Tier
Signal confidence remains moderate in the compression thesis. We are not observing broad forced liquidity characteristics consistent with Phase Three or Phase Four. However, labor and credit transmission remain key watchpoints into twenty twenty seven.
Our Strategy prioritizes sequencing over headlines. Migration direction alone does not determine prices. Net absorption under prevailing financing conditions determines prices. Until that alignment improves, adjustment precedes expansion.
📊 Run Your Own Analysis
Use the BuildersLens 65-Signal Analyzer to see live macro positioning for tickers mentioned in this article:
→ Analyze TLT (Long-Term Treasuries)
→ Analyze HYG (High Yield Credit)
This article is for educational and informational purposes only and does not constitute investment advice. Past performance is not indicative of future results. Consult with a qualified financial advisor before making investment decisions.