Research · Cycle Sequencing & Phases
Odds of New Highs Are Rising — But Here’s the Catch

Markets Are Reacting to Headlines — Regimes Are Defined by Liquidity
The recent tariff ruling, mixed growth data, and inflation prints have triggered tactical market reactions. However, under Our Strategy’s phase-based framework, price reactions do not automatically imply regime transitions.
Mechanisms matter more than narratives. Liquidity momentum, risk appetite, credit spreads, yield behavior, and breadth collectively define phase pressure. At present, signals suggest continued late Phase Two multiple compression and rotation rather than a renewed Phase One melt up.
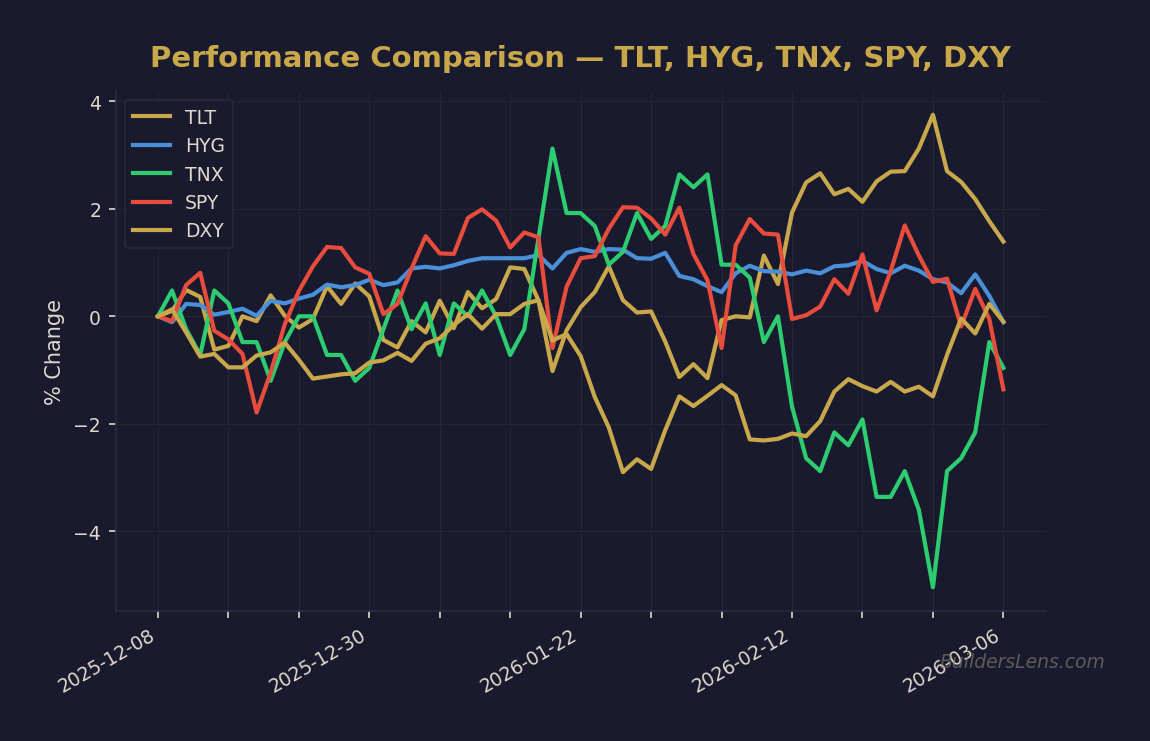
Source: BuildersLens.com Signal Framework | Data as of March 08, 2026
Current Regime Mapping
Operational Phase Assessment
- Phase One Melt Up Participation: Narrow leadership remains possible but lacks liquidity acceleration confirmation.
- Phase Two Multiple Compression and Rotation: Primary regime pressure.
- Phase Three Credit Breakdown: Early stage monitoring only.
- Phase Four Forced Liquidity Event: Low immediate probability but structurally rising over a multi quarter horizon.
- Phase Five Post Stress Accumulation: Not yet active.
Date Anchored Probabilities
- Sixty percent probability Phase Two persists into June 2026.
- Twenty five percent probability Liquidity re accelerates and extends selective upside into March 2026.
- Fifteen percent probability Credit deterioration accelerates before December 2025.
- If Phase Three develops, Phase Four policy collision risk rises into mid 2026.
- Most likely window for Phase Five accumulation: late 2026 into 2027.
Mechanism: Why New Highs Can Occur Inside Compression
Markets can test or marginally exceed prior highs even when structural pressure is building. This typically occurs when:
- Liquidity stabilizes but does not accelerate.
- Credit spreads remain contained.
- Under positioning forces incremental buying.
- Long term yields stall or drift lower.
This creates an environment where upside attempts are possible without signaling durable regime expansion. Valuations compress slowly even as price grinds.
Signal Stack Monitoring
Liquidity and Funding
- Bank reserve trends
- Treasury auction demand and tail behavior
- Funding market stability
Credit
- High yield spreads
- Default trends
- Lending standards surveys
Rates
- Ten year and thirty year yield direction
- Real yield behavior
- Term premium pressure
Breadth and Concentration
- Advance decline participation
- Sector dispersion
- Leadership durability
Monitoring Tickers for Observation Only
- SPY broad equity proxy
- SMH semiconductor leadership
- TLT and ZROZ duration sequencing
- DXY dollar constraint
- HYG credit proxy
- GLD monetary hedge
- BTC liquidity sensitivity
What Changes and What Does Not
What Has Changed
- Short term probability of new highs has increased.
- Rotation into selective leadership has strengthened.
- Positioning pressure has eased.
What Has Not Changed
- Liquidity momentum is not accelerating.
- Credit is not meaningfully expanding.
- Structural late cycle characteristics remain present.
Invalidation Conditions
This framework requires reassessment if:
- High yield spreads widen rapidly.
- Long term yields spike in disorderly fashion.
- Funding markets show persistent stress.
- Breadth collapses back into extreme concentration.
Conclusion: Probability Expansion Is Not Regime Reset
Markets may attempt new highs, and probability has shifted modestly in that direction. However, probability expansion inside late cycle compression does not equal durable structural reset.
Our Strategy remains sequencing focused, probability driven, and conditional. Liquidity, credit, and yield behavior will determine whether this becomes continuation or transition.
Get the Daily Phase Brief
Signal changes, data releases to watch, and today’s regime assessment — delivered every morning before market open.
Join investors tracking the macro cycle. Unsubscribe anytime.
📊 Run Your Own Analysis
Use the BuildersLens 65-Signal Analyzer to see live macro positioning for tickers mentioned in this article:
→ Analyze TLT (Long-Term Treasuries)
→ Analyze HYG (High Yield Credit)
This article is for educational and informational purposes only and does not constitute investment advice. Past performance is not indicative of future results. Consult with a qualified financial advisor before making investment decisions.