Research · Credit & Liquidity
Private Credit Cracks in Multifamily: A Late-Cycle Credit Signal
Private Credit Cracks in Multifamily: A Late-Cycle Credit Signal
In Our Strategy, credit stress is never treated as a headline event.
It is treated as a sequencing signal. Recent write-downs
in private credit exposure tied to multifamily real estate matter not
because losses exist, but because they are now being acknowledged by
large, institutional asset managers.
That timing is critical. Large institutions rarely lead recognition
cycles. They confirm pressures that have already been present beneath
the surface.
What the Source Video Is Actually Claiming
The source discussion highlights mounting write-downs in private credit
portfolios linked to multifamily assets. Loans originated under low-rate
assumptions are colliding with higher refinancing costs, rising operating
expenses, and flattening or declining rent growth.
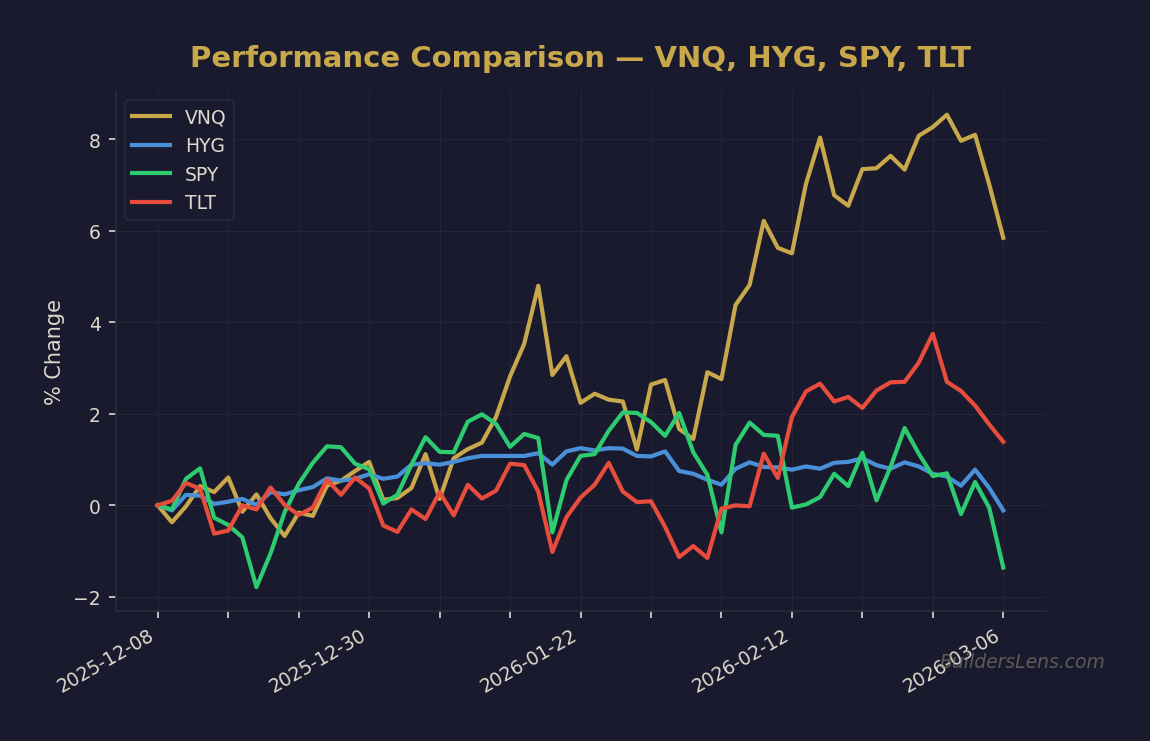
Source: BuildersLens.com Signal Framework | Data as of March 08, 2026
As maturities approach, equity cushions are eroded and refinancing math
fails. Losses are not sudden—they are recognized only when time runs out.
Signal Classification Within Our Strategy
- Credit stress: Private credit and shadow-banking exposure
- Housing transmission: Multifamily refinancing pressure
- Liquidity timing: Recognition lag versus economic reality
This is a credit-cycle confirmation signal, not a standalone
macro trigger.
The Mechanism: Why This Took Time to Surface
Private credit sits outside traditional banking balance sheets.
Losses are absorbed by funds, institutions, and allocators rather than
transmitted immediately to households. That structure delays visible
stress without eliminating it.
The transmission path is mechanical:
- Higher rates reprice refinancing assumptions
- Operating costs outpace rent growth
- Equity buffers shrink as maturities approach
- Losses surface only when refinancing fails
Markets often misinterpret this delay as resilience. In reality, it is
a timing mismatch between asset valuation and funding constraints.
Phase Mapping: Where This Fits in the Cycle
Within Our Strategy framework, this signal aligns with
late Phase 1: Melt-Up With Cracks.
On its own, this does not confirm a Phase 2 forced-liquidity
cascade. It does, however, raise the probability that credit stress
becomes an accelerant if paired with funding pressure, labor
deterioration, or broader housing weakness.
Probability & Timeline Assessment (Non-Predictive)
-
Phase 1 continuation:
~55–65% probability through mid-2026 as losses remain institutionally
contained. -
Transition toward Phase 2 stress:
~25–35% probability by December 2026 if refinancing failures broaden
and liquidity tightens. -
Phase 3 policy-response environment:
~15–25% probability by June 2027, conditional on funding or labor
confirmation.
These ranges describe sequencing, not outcomes. Timelines compress only
if multiple signal pillars align.
What Changes in Our Strategy
- Higher sensitivity to private credit and CRE refinancing data
- Greater focus on dispersion across assets, sponsors, and structures
- Reduced reliance on liquidity alone to indefinitely delay recognition
What Does Not Change
- This is not a 2008-style household balance-sheet crisis
- It does not imply immediate stress for renters or consumers
- It does not negate liquidity’s ability to delay broader contagion
- It does not justify front-running forced-liquidity phases
Signals We Continue to Monitor
- Private credit fund write-downs and redemption terms
- Multifamily loan extensions versus true refinancing
- Commercial mortgage maturity concentration
- Credit spreads and funding-market behavior
- Public proxies such as BDC performance (monitoring only)
Invalidation Conditions
- Sustained easing in refinancing costs without policy distortion
- Broad rent reacceleration restoring equity cushions
- Material credit-spread compression alongside renewed issuance
Source
This article is for educational and informational purposes only. It reflects a
probability-based analytical framework and does not constitute investment advice
or a recommendation to buy or sell any asset.
Get the Daily Phase Brief
Signal changes, data releases to watch, and today’s regime assessment — delivered every morning before market open.
Join investors tracking the macro cycle. Unsubscribe anytime.
📊 Run Your Own Analysis
Use the BuildersLens 65-Signal Analyzer for live macro positioning:
→ Analyze HYG (High Yield Credit)