Research · Credit & Liquidity
Property Taxes, Debt Expansion, and Housing Phase Pressure

Property Taxes, Debt Pressure, and Housing Structure
Property tax collections have expanded materially since twenty nineteen. At the same time, federal debt levels continue to rise, and long-duration yields remain sensitive to supply dynamics and term premium shifts. The analytical question is not whether these trends are politically controversial. The question is whether they represent early phase pressure within a broader macro sequencing framework.
Mechanism One: Fiscal Arithmetic at the Local Level
Municipal governments are structurally revenue-constrained. When federal transfers normalize and wage growth slows, property assessments become the most stable revenue base. Real estate is immobile, taxable, and administratively efficient.
Rising assessments increase household carrying costs. Higher property taxes, insurance premiums, and mortgage rates compress disposable income. However, cost compression alone does not produce systemic repricing. The transmission mechanism must move through credit.
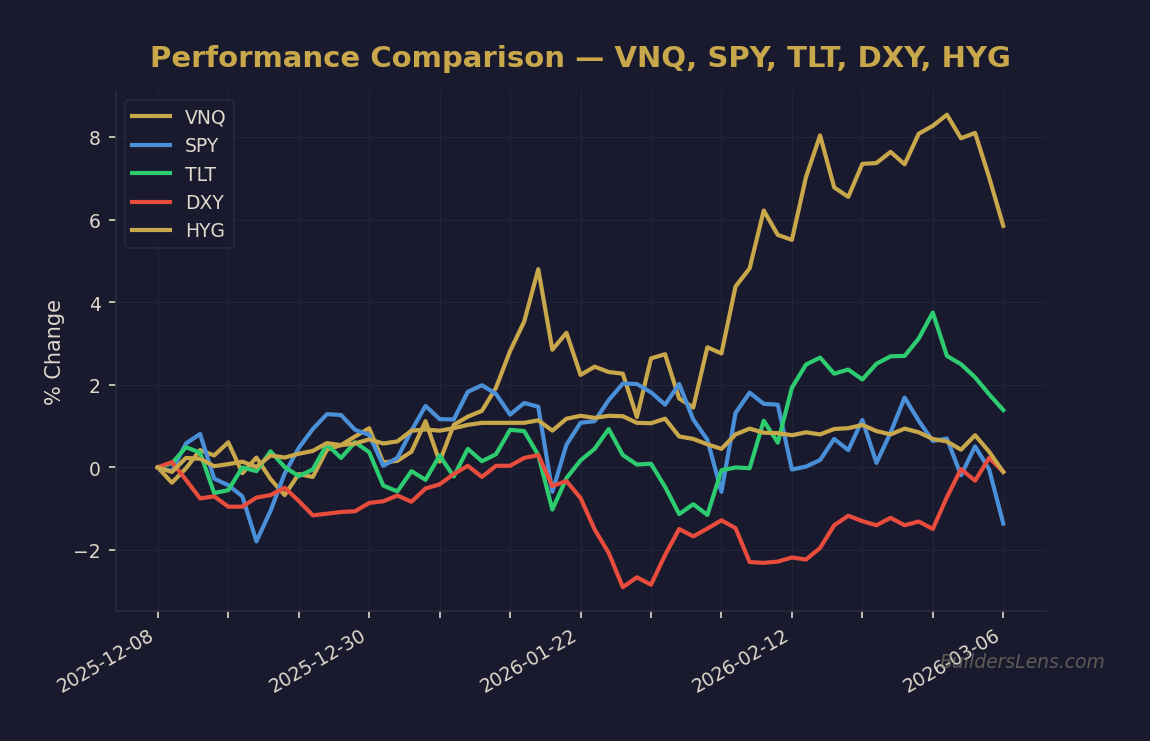
Source: BuildersLens.com Signal Framework | Data as of March 08, 2026
Mechanism Two: Debt Sustainability and Financial Repression Risk
National debt expansion is often framed as a binary inflation outcome. Our Strategy instead evaluates debt sustainability through the interaction of nominal growth, real rates, and term premium behavior. Historically, sovereigns adjust through combinations of moderate inflation tolerance, yield curve management, and extended maturities.
The key monitoring variable is long-duration yield behavior relative to policy expectations. If long yields remain elevated despite growth moderation, refinancing pressure increases across both public and private sectors.
Mechanism Three: Housing Structure and Institutional Absorption
Post-global-financial-crisis housing resolution behavior differs from two thousand eight. Large blocks of non-performing loans are often sold directly to institutional buyers rather than liquidated piecemeal into retail markets.
This suppresses visible inventory spikes. Optical stability does not guarantee underlying stability. Credit transmission remains the decisive factor.
Phase Mapping Within Our Strategy Framework
Current Phase Assessment (Late Phase One Pressure): Approximately sixty percent probability of continued choppy melt-up or range behavior through mid twenty twenty-six, assuming liquidity remains supportive and credit spreads contained.
Next Phase (Phase Two Multiple Compression): Roughly thirty percent probability of transition by June twenty twenty-six if hiring rates weaken, high-yield spreads widen, and breadth deteriorates.
Phase Three Credit Stress Window: Approximately twenty percent probability within twelve months, conditional on sustained funding stress, auction weakness, and rising delinquencies.
Phase Four Forced Liquidity: Lower probability scenario unless Phase Three confirmation emerges. Requires mechanical selling, disorderly funding markets, and policy collision.
What Changes vs What Does Not Change
What Changes:
- Household cash flow compression increases vulnerability to labor deterioration.
- Institutional ownership alters housing supply optics.
- Debt supply influences term premium sensitivity.
What Does Not Change:
- Liquidity remains the primary stabilizer in early phases.
- Credit spreads remain the transmission trigger.
- Phase shifts require confirmation across labor, credit, and rates.
Multi-Asset Monitoring Dashboard
- SPY: breadth and multiple compression behavior
- TLT and ZROZ: long-duration yield confirmation or rollover trap risk
- DXY: global funding constraint signal
- High-yield spreads: credit stress transmission
- Housing data: delinquencies, foreclosure trends, builder incentives
Invalidation Conditions
- Sustained credit spread compression despite fiscal strain
- Re-acceleration in hiring and wage growth stability
- Stable or declining long yields without funding stress
Signal Confidence Tier
Current signal confidence is moderate. Fiscal strain is visible. Credit confirmation is incomplete. Liquidity remains the decisive variable. Until funding markets deteriorate, phase escalation remains conditional rather than deterministic.
Get the Daily Phase Brief
Signal changes, data releases to watch, and today’s regime assessment — delivered every morning before market open.
Join investors tracking the macro cycle. Unsubscribe anytime.
📊 Run Your Own Analysis
Use the BuildersLens 65-Signal Analyzer to see live macro positioning for tickers mentioned in this article:
→ Analyze TLT (Long-Term Treasuries)
→ Analyze HYG (High Yield Credit)
This article is for educational and informational purposes only and does not constitute investment advice. Past performance is not indicative of future results. Consult with a qualified financial advisor before making investment decisions.