Research · Cycle Sequencing & Phases
Sector Rotation, Concentration Risk, and the Transition from Melt-Up to Compression
Sector Rotation, Concentration Risk, and the Transition from Melt-Up to Compression
Markets rarely break at the moment of maximum fear. They typically fracture when confidence remains elevated and concentration risk is ignored. What we are observing now is not merely volatility. It is structural pressure forming beneath index stability.
As of year-end positioning, technology represented roughly one third of the S and P five hundred, while mining exposure remained near one percent. That imbalance is not simply descriptive. It creates asymmetry when capital begins to rotate. When leadership narrows to a handful of mega-cap growth names, liquidity dependency rises and internal fragility increases.
Source: BuildersLens.com Signal Framework | Data as of March 08, 2026
Framework Mapping: Where We Are in the Phase Model
Within Our Strategy’s five-phase operational framework, current conditions most closely align with late Phase One transitioning toward Phase Two.
- Phase One continuation probability into June twenty twenty six: approximately sixty percent.
- Phase Two compression deepening by mid-year twenty twenty six: approximately thirty percent incremental probability beyond current pressure.
- Phase Three breakdown acceleration before December twenty twenty six: approximately ten percent.
This distribution reflects observable sector rotation, elevated concentration, modest volatility expansion, and early signs of valuation compression — while credit and funding markets remain broadly contained.
Mechanism Over Narrative: Why Rotation Happens
When liquidity expansion slows, equity performance becomes increasingly sensitive to valuation durability. High-duration growth equities rely on discounted future cash flows and stable yield structures. If long-term yields stall or rise while earnings momentum plateaus, multiple compression can occur without a formal recession.
Real asset sectors such as mining respond to different drivers. They are more sensitive to commodity price spreads, fiscal impulse, and supply constraints than to long-duration discount rate assumptions. When capital rotates into these areas, it often reflects a change in risk tolerance rather than a macro collapse.
This is why a potential “triple top” is less important as a chart pattern and more important as a behavioral signal. Repeated attempts to push higher without durable follow-through often indicate marginal buyer exhaustion.
Credit, Liquidity, and Yield Monitoring
Rotation alone does not create a breakdown. The transmission mechanism is credit and funding.
- Credit spreads: widening high-yield spreads would confirm deeper compression pressure.
- Yield behavior: if long-term yields refuse to decline as growth softens, duration-sensitive equities face structural pressure.
- Liquidity plumbing: repo stress, weak Treasury auctions, or funding volatility would accelerate Phase Three probability.
- Dollar strength: a rising D X Y tightens global conditions and pressures emerging markets and commodities.
At present, these signals show tension but not disorder.
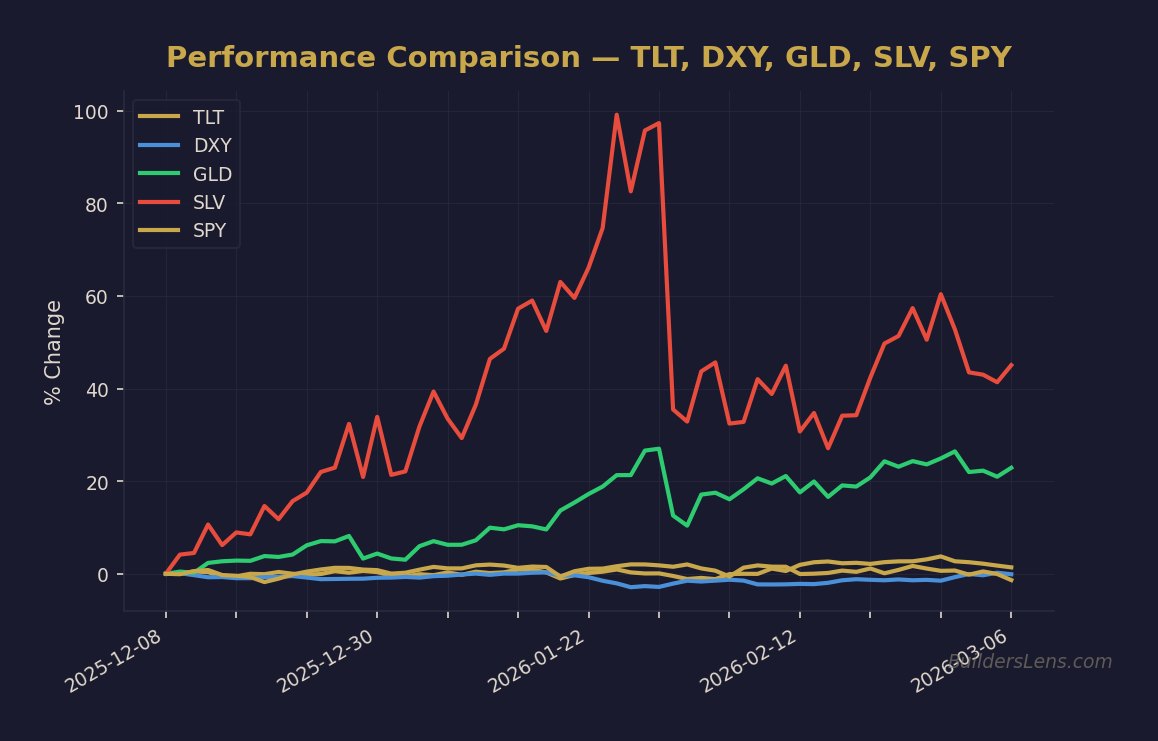
Gold, Silver, and Mining Within the Sequence
Gold’s structural bid reflects reserve diversification and policy uncertainty rather than short-term speculation. Silver carries dual exposure — monetary and industrial — which amplifies volatility in both directions. Mining equities provide operational leverage to metal price spreads but remain equities and therefore sensitive to liquidity stress.
In true liquidity squeezes, mining equities can initially decline alongside broader markets before benefiting from policy stabilization phases. This sequencing is critical. Signal interpretation must precede conviction.
What Changes and What Does Not
What is changing:
- Sector leadership is rotating away from narrow technology concentration.
- Volatility is expanding modestly.
- Relative performance in materials and mining is improving.
What has not changed:
- Credit markets have not yet signaled systemic stress.
- Liquidity has not collapsed.
- Earnings deterioration remains gradual rather than disorderly.
Forward Probability Timeline
Through June twenty twenty six: Elevated probability of rotational volatility within a broad range as Phase Two pressure builds.
Into December twenty twenty six: Increased probability of deeper compression if credit spreads widen or liquidity tightens materially.
Into June twenty twenty seven: Probability of Phase Three to Phase Four transition rises if labor deterioration and refinancing stress accelerate.
Invalidation Conditions
- Sustained improvement in equity breadth beyond mega-cap concentration.
- Stable or tightening credit spreads through multiple earnings cycles.
- Long-term yields declining without funding stress.
If these conditions persist, Phase One continuation probability increases and compression risk moderates.
Conclusion: Optionality Over Certainty
This is not a prediction window. It is a sequencing window. When concentration, liquidity plateau, and sector rotation align, markets become structurally sensitive even in the absence of dramatic headlines.
Our Strategy remains probability-based, signal-driven, and disciplined around optionality. In transitional regimes, survival and flexibility consistently outperform conviction and narrative.
Get the Daily Phase Brief
Signal changes, data releases to watch, and today’s regime assessment — delivered every morning before market open.
Join investors tracking the macro cycle. Unsubscribe anytime.
📊 Run Your Own Analysis
Use the BuildersLens 65-Signal Analyzer to see live macro positioning for tickers mentioned in this article:
→ Analyze TLT (Long-Term Treasuries)
📊 Run Your Own Analysis
Use the BuildersLens 65-Signal Analyzer to see live macro positioning for tickers mentioned in this article:
→ Analyze TLT (Long-Term Treasuries)
📊 Run Your Own Analysis
Use the BuildersLens 65-Signal Analyzer for live macro positioning:
This article is for educational and informational purposes only and does not constitute investment advice. Past performance is not indicative of future results. Consult with a qualified financial advisor before making investment decisions.