Research · Narrative Translation
Silver’s Move Is About Incentives, Not Headlines

Silver’s Breakout: Mechanism, Incentives, and Phase Pressure
The Vancouver Resource Investment Conference discussion with Aftermath Silver highlights a recurring pattern in commodity cycles: price accelerates when structural demand, positioning reflexivity, and funding conditions converge.
Our Strategy does not evaluate this through price targets. We evaluate through transmission mechanisms and phase sequencing.
Mechanism One: Industrial Demand Elasticity
Silver’s industrial share has increased materially over the past several decades. Electrification, artificial intelligence infrastructure, and solar applications embed silver into capital-intensive systems. This reduces the purely monetary framing and increases hybrid demand exposure.
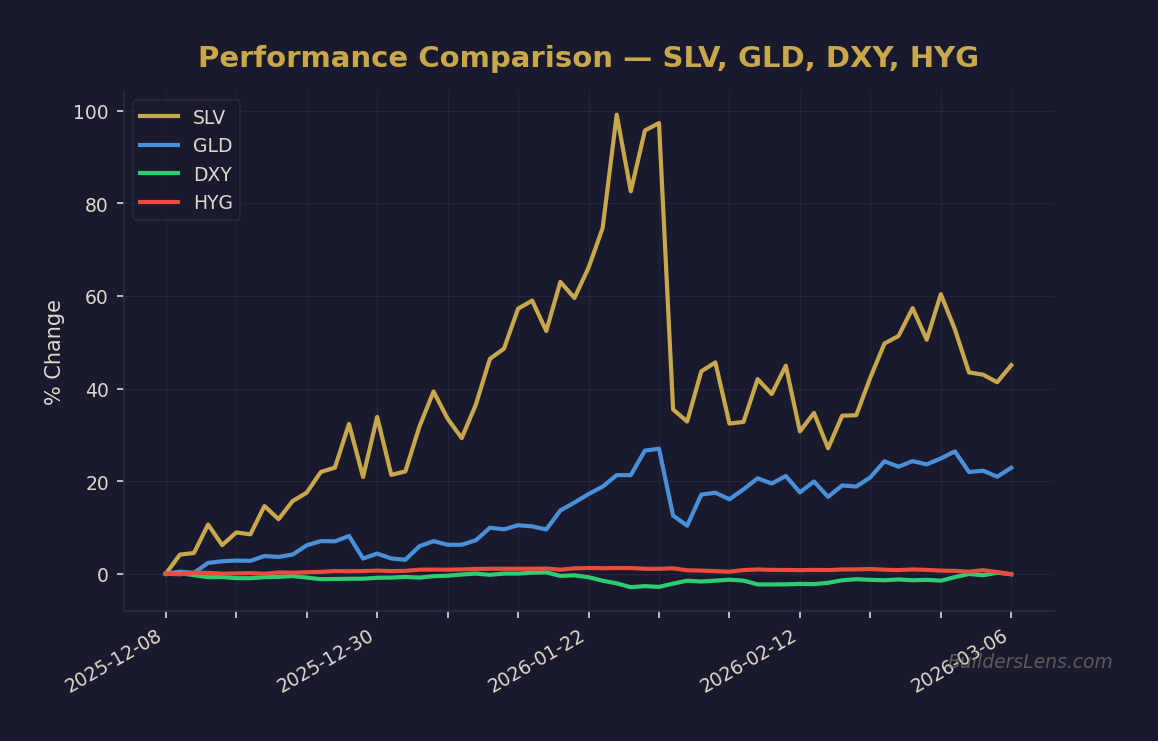
Source: BuildersLens.com Signal Framework | Data as of March 08, 2026
Unlike gold, silver supply is frequently a byproduct of lead and zinc mining. That creates supply inelasticity relative to price, particularly in early cycle stages. Incentive pricing for expansion was referenced in the thirty to thirty five dollar range, with all in sustaining costs near twenty to twenty two dollars. The gap between those levels and current pricing introduces operating leverage.
Mechanism Two: Margin Convexity
When pricing exceeds incentive thresholds sustainably, producer margins expand non-linearly. Projects previously marginal become financeable. However, large-scale capital expenditure decisions require price stability, not transient spikes. This distinction separates speculative enthusiasm from balance sheet commitment.
Mechanism Three: Positioning and Short Covering
The discussion referenced concentrated short positioning and gold-silver ratio compression. In reflexive markets, short covering can accelerate moves beyond fundamental equilibrium. This is characteristic of late Phase One environments in Our Strategy framework.
Phase Mapping Within Our Strategy
Current Assessment (February 2026): Late Phase One with rising Phase Two volatility probability.
- Phase One continuation probability (through June 2026): Approximately sixty percent if liquidity remains supportive and credit spreads remain contained.
- Phase Two retracement probability (into late 2026): Approximately thirty percent if term premium rises or funding tightens.
- Phase Three disorder probability (into early 2027): Approximately ten percent, conditional on broader credit stress.
These probabilities are conditional and will adjust with changes in credit spreads, funding markets, and real yield behavior.
What Changes vs. What Does Not
What Changes
- Capital formation in silver projects becomes viable at sustained elevated pricing.
- Bank engagement increases, signaling improved funding receptivity.
- Margin expansion materially improves project economics.
What Does Not Change
- Large-scale mine development remains capital intensive and sensitive to discount rates.
- Byproduct supply dynamics continue to anchor long-term elasticity.
- Credit conditions ultimately govern sustained expansion.
Multi-Asset Monitoring Dashboard
- Real Yields: Monitor for sustained decline versus term premium expansion.
- High Yield Credit Spreads: Early warning for Phase Two stress.
- DXY: Sharp appreciation could tighten global liquidity.
- Gold-Silver Ratio: Structural compression versus reflexive spike.
- Mining Equity Relative Strength: Confirmation of capital reopening.
Invalidation Conditions
- Sustained widening in high yield spreads.
- Term premium spike driving long-duration yields higher.
- Industrial demand slowdown data contradicting structural thesis.
Conclusion
Silver’s current strength reflects incentive structure alignment rather than simple narrative enthusiasm. Industrial demand growth, supply elasticity constraints, and positioning reflexivity can coexist in late Phase One. However, durability depends on funding stability and credit containment.
Our Strategy remains confirmation-driven. We monitor liquidity, credit, and real rates rather than anchoring to price targets.
Educational analysis only. Not investment advice.
Get the Daily Phase Brief
Signal changes, data releases to watch, and today’s regime assessment — delivered every morning before market open.
Join investors tracking the macro cycle. Unsubscribe anytime.
📊 Run Your Own Analysis
Use the BuildersLens 65-Signal Analyzer for live macro positioning:
→ Analyze HYG (High Yield Credit)
This article is for educational and informational purposes only and does not constitute investment advice. Past performance is not indicative of future results. Consult with a qualified financial advisor before making investment decisions.