Research · Market Internals
Silver’s Violent Reversal: What This Volatility Signals Late-Cycle

Silver’s Violent Reversal: What This Volatility Signals Late-Cycle
In Our Strategy, we do not treat sharp price moves as forecasts.
We treat them as information about positioning, leverage,
and liquidity. Silver’s recent violent two-way move—first
collapsing, then rebounding sharply—fits squarely into that lens.
The question is not whether silver “bottomed.” It is what this
volatility reveals about late-cycle market structure.
What the Source Video Is Actually Claiming
The source video walks through recent silver price action, highlighting
forced selling, an intraday reversal, and a sharp rebound. The emphasis
is on market psychology, positioning, and disciplined exits rather than
long-term directional forecasts.
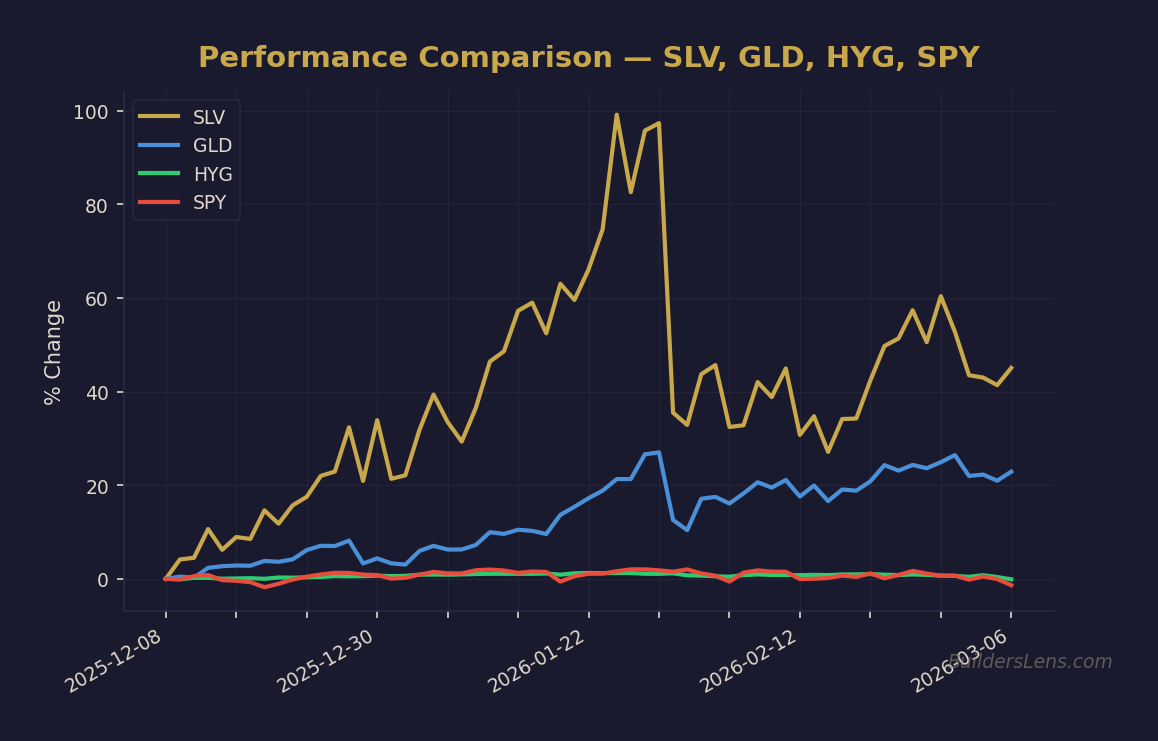
Source: BuildersLens.com Signal Framework | Data as of March 08, 2026
The core takeaway is behavioral: extreme moves tend to emerge when
leverage is crowded and liquidity thins.
Signal Classification Within Our Strategy
- Liquidity sensitivity: Silver as a high-beta expression of liquidity conditions
- Positioning: Crowded exposure amplifying downside and upside moves
- Market structure: Thin liquidity producing outsized intraday ranges
- Risk appetite: Reflexive buying and short-covering dynamics
This is a volatility and positioning signal, not a regime-change signal.
The Mechanism: Why Silver Moves Violently Late Cycle
Silver occupies a unique position in markets. It is both a monetary
asset and a speculative vehicle. That combination makes it highly
sensitive to changes in liquidity and risk appetite.
Late in cycles, several forces converge:
- Leverage and speculative positioning increase
- Liquidity becomes less reliable intraday
- Forced selling triggers mechanical moves
- Short-covering and reflexive buying fuel sharp rebounds
These moves often look dramatic, but they are typically structural
responses to positioning rather than confirmation of a new trend.
Phase Mapping: Where This Fits in the Cycle
Within Our Strategy framework, this behavior aligns with
late Phase 1: Melt-Up With Rising Instability.
Markets are still functioning, but volatility is no longer suppressed.
Assets with leverage and thin liquidity begin to exhibit exaggerated
price behavior.
Probability & Timeline Assessment (Non-Predictive)
-
Phase 1 continuation with elevated volatility:
~60–70% probability through mid-2026 as liquidity remains present
but uneven. -
Transition toward Phase 2 conditions:
~20–30% probability by December 2026 if volatility spreads beyond
reflexive assets into credit and funding markets. -
Phase 3 policy-dominant regime:
~15–25% probability by June 2027, conditional on tightening
financial conditions and broader de-risking.
Silver volatility alone does not force a phase transition. It raises
awareness of instability.
What Changes in Our Strategy
- Greater respect for volatility as a positioning signal
- Reinforced importance of sizing and exit discipline
- Higher sensitivity to reflexive behavior in high-beta assets
What Does Not Change
- No confirmation of a new secular bull regime in silver
- No abandonment of confirmation-based sequencing
- No shift away from optionality and risk control
- No extrapolation from short-term volatility into long-term forecasts
Signals We Continue to Monitor
- Silver versus gold relative performance
- Volume behavior during selloffs and rebounds
- Follow-through versus fade after sharp reversals
- Broader liquidity and credit conditions
- Monitoring proxies such as SLV, PSLV, and GLD
Invalidation Conditions
- Sustained trend persistence without extreme intraday volatility
- Broad liquidity expansion accompanied by stable positioning
- Compression in volatility across other high-beta risk assets
Source
This article is for educational and informational purposes only.
It reflects a probability-based analytical framework and does not
constitute investment advice or recommendations.
Get the Daily Phase Brief
Signal changes, data releases to watch, and today’s regime assessment — delivered every morning before market open.
Join investors tracking the macro cycle. Unsubscribe anytime.
📊 Run Your Own Analysis
Use the BuildersLens 65-Signal Analyzer for live macro positioning:
This article is for educational and informational purposes only and does not constitute investment advice. Past performance is not indicative of future results. Consult with a qualified financial advisor before making investment decisions.