Research · Credit & Liquidity
S&P 7,000 Stalls: Rotation or Phase Shift?
S&P 7,000 Stalls: Rotation or Phase Shift?
The S&P 500 keeps testing 7,000 and keeps failing to hold it.
Markets push up to that level, flirt with a breakout for a day or two, then retreat. Meanwhile, we’re seeing growing internal stress: leadership rotation, weakening momentum, and key technical levels being broken and retested.
So what’s happening here?
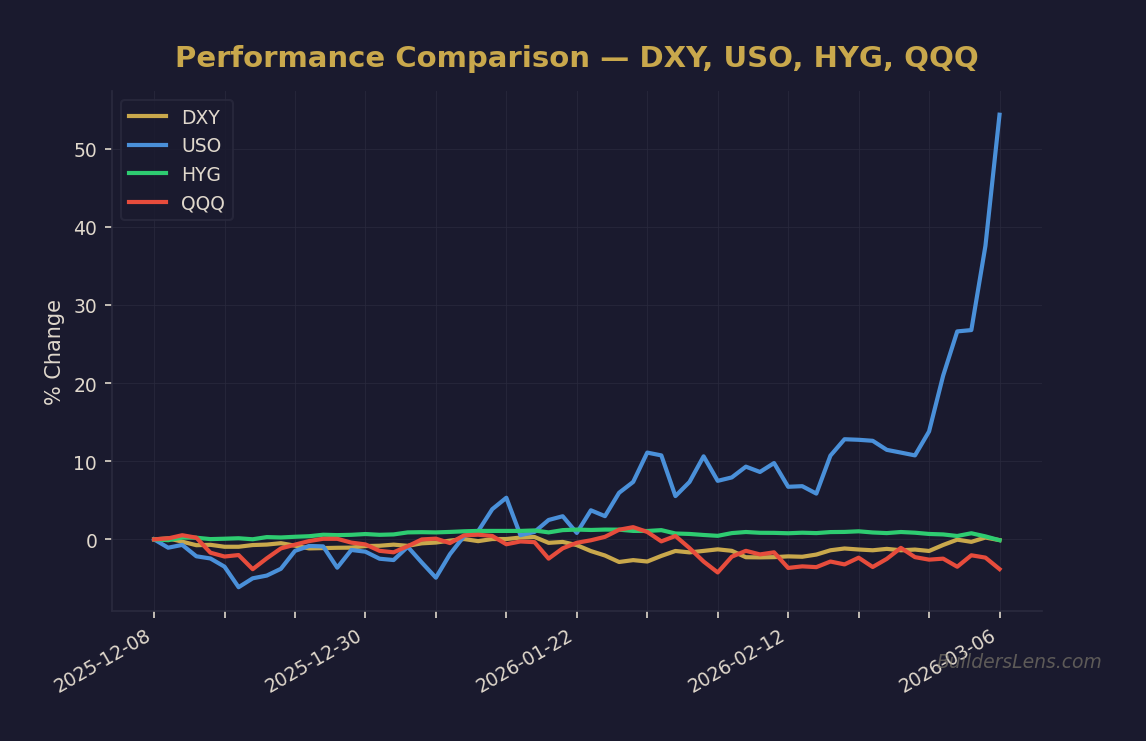
Source: BuildersLens.com Signal Framework | Data as of March 08, 2026
Is this simply a healthy sector rotation, or are we witnessing early pressure that could evolve into a broader phase shift in the market cycle?
The 7,000 Wall
Round numbers matter.
Not because they have magical properties, but because positioning and psychology often cluster around them. Institutional rebalancing, options activity, and investor anchoring can all intensify near major levels.
The S&P has repeatedly challenged 7,000 and failed to sustain traction above it. At the same time, short-term support levels have been tested and momentum has become less clean.
This does not imply a crash. But it does imply the upside path is less frictionless than it was during the prior advance.
Rotation Under the Surface
One of the most important developments is capital rotation.
Money has been flowing out of areas that led prior advances, including many high-growth software and AI related names, and into areas that are typically treated as more defensive or cyclical value exposures, such as energy, industrials, materials, and consumer staples.
Rotation is not inherently bearish. It can be the market’s way of resetting positioning while maintaining an overall uptrend.
The nuance is that parts of the defensive complex can become crowded and overextended, while prior leaders can become oversold. When that gap widens, the market’s next move often depends on whether growth reasserts itself or whether defensive positioning persists.
Valuations Are Not What the Headlines Suggest
A common narrative is that technology is expensive and value is cheap. In practice, valuation is relative to growth and durability, and rotations can temporarily invert those relationships.
After recent corrections, some large, durable software and technology businesses trade at materially lower forward multiples than they did during peak enthusiasm, while some slow-growth sectors trade at historically elevated valuation levels relative to their own earnings trajectories.
Markets often chase what is working in the moment. Over time, fundamentals and growth durability tend to reassert influence, especially when the market’s narrative changes.
Inflation, Housing, and the Macro Backdrop
Headline inflation has been drifting lower, and housing related components remain an important swing factor for the inflation path. If shelter continues to disinflate, it can mechanically pull broader CPI lower even if other categories remain sticky.
At the same time, narratives around reflation and stronger growth can persist in markets even when underlying inflation indicators are cooling. That tension matters because it shapes what sectors attract marginal flows.
If disinflation persists while growth slows, market leadership can rotate again, often back toward higher-quality growth or duration-sensitive exposures. If reflation strengthens instead, cyclicals may continue to outperform.
Rotation or Phase Shift?
In Our Strategy, we treat this environment as late-cycle and confirmation-driven. The key question is not whether markets feel volatile day to day, but whether internal signals are transitioning from a rotation regime into a broader repricing regime.
A true phase shift typically involves a cluster of confirmations, including persistent deterioration in market internals, tightening in credit conditions, and a sustained decline in earnings expectations that forces repricing across risk assets.
We are not fully there yet. But the pressure is building enough that we treat this as a higher vigilance setup rather than a clean continuation setup.
What We Watch Next
Instead of predicting outcomes, we track confirmations and invalidations. In practice, we watch whether leadership stabilizes, whether breadth improves or deteriorates, whether credit conditions stay contained, and whether commodity and dollar signals confirm or contradict reflation narratives.
- Market breadth: participation across sectors and market caps, not just index levels
- Credit conditions: whether spreads remain calm or begin to widen persistently
- Energy confirmation: whether oil prices validate energy equity strength
- Dollar direction: whether funding conditions tighten through sustained dollar strength
- Housing and inflation: whether disinflation continues to pull macro expectations lower
The Bigger Picture: AI and Structural Change
Beyond the near-term rotation, a larger structural transformation is unfolding in AI. Capability gains can compress timelines for automation and productivity shifts, which may eventually transmit into labor dynamics, earnings composition, and capital allocation decisions.
Markets can ignore structural changes for long stretches when liquidity is supportive. But once the labor or earnings transmission becomes visible, repricing can happen quickly. We treat AI as a structural variable that interacts with the cycle rather than a standalone narrative.
Conclusion
S&P 7,000 is not just a number. It is a signal point where positioning, psychology, and liquidity meet.
If leadership broadens, credit remains stable, and growth expectations hold, the stall may resolve as a rotation and consolidation phase. If internals continue to deteriorate and credit tightens, transition probability rises.
Our focus remains process and optionality: staying flexible, watching confirmations, and avoiding narrative-driven extremes.
Sources
-
Referenced discussion video:
https://youtu.be/jnaFB4923tg?si=l4gOJnzldwIdGMch -
Bureau of Labor Statistics CPI:
https://www.bls.gov/cpi/ -
FRED economic data:
https://fred.stlouisfed.org/ - Sector valuation and performance data: publicly available market data providers
Sponsor
This analysis is made possible by our sponsor:
For full macro strategy research and ongoing phase calibration, visit:
This content is for educational purposes only and is not investment advice. Always do your own research and consult with a qualified professional before making financial decisions.
Get the Daily Phase Brief
Signal changes, data releases to watch, and today’s regime assessment — delivered every morning before market open.
Join investors tracking the macro cycle. Unsubscribe anytime.
📊 Run Your Own Analysis
Use the BuildersLens 65-Signal Analyzer for live macro positioning:
This article is for educational and informational purposes only and does not constitute investment advice. Past performance is not indicative of future results. Consult with a qualified financial advisor before making investment decisions.