Research · Market Internals
Tech Spreads Are Widening Beneath the Surface

The 15-Year Correlation Break Beneath the Index
In early 2026, we are observing a structural divergence that has not appeared in more than a decade. Mega-cap technology leadership is weakening while the broader index remains relatively stable. At the same time, tech bond spreads are widening relative to high-grade corporates. This combination signals early-phase repricing beneath surface stability.
Buybacks vs Capex: A Reflexivity Shift
For years, equity reflexivity was supported by aggressive buybacks. Capital returned to shareholders supported price stability and momentum. In 2026, that structure is shifting. Capex — particularly AI data center investment — is replacing buybacks as the primary capital allocation mechanism.
Source: BuildersLens.com Signal Framework | Data as of March 08, 2026
Capex supports future productivity but consumes present liquidity. Free cash flow compression and increased debt issuance alter the perceived safety profile of large-cap technology firms. Credit markets tend to detect that shift before equity indices fully reflect it.
Tech Spread Widening: Why Credit Matters First
Technology bond spreads are widening relative to broader high-grade credit. This marks a regime shift. For much of the prior cycle, mega-cap technology traded at tighter spreads than generic high-grade corporates. That premium is now compressing.
Spread widening is not yet disorderly. However, early credit repricing often precedes equity volatility expansions. We classify this as rising Phase 2 probability, not confirmed Phase 3 stress.
Rotation Signals and Breadth Behavior
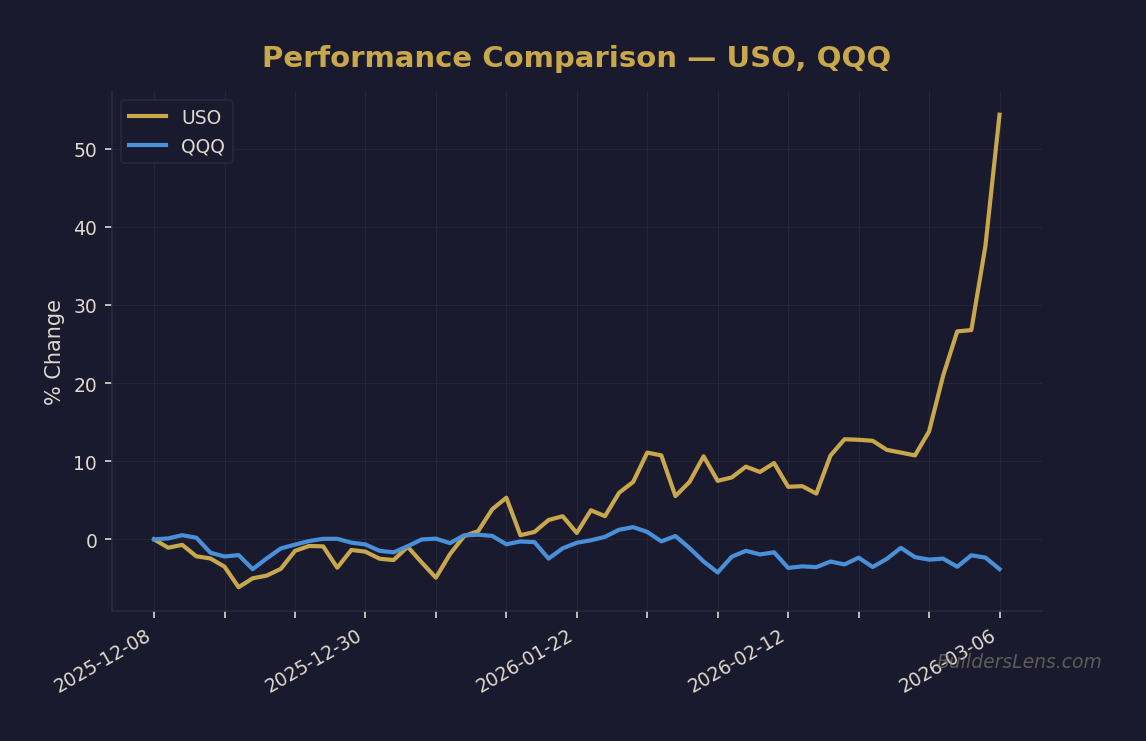
Defensive sectors including utilities and staples are outperforming. Financials are under pressure. Energy and oil services show relative strength. Meanwhile, the advance-decline line remains constructive.
This combination suggests rotational compression rather than systemic breakdown. Late-cycle environments frequently display this pattern before credit conditions deteriorate materially.
Gamma Positioning and Index Structure
Major indices are positioned near large put walls. If these levels hold, markets can remain range-bound. If they fail, negative gamma dynamics could accelerate hedging flows and volatility expansion.
This is positioning reflexivity — not macro inevitability. Structural confirmation requires credit and funding stress.
Consumer Strain and Corporate Leverage
Rising student loan delinquencies and incremental mortgage stress suggest consumer cash flow is tightening. When combined with corporate capex intensity and debt issuance, systemic liquidity becomes more sensitive to shocks.
We monitor this transmission channel closely as it determines whether Phase 2 remains rotational or evolves toward Phase 3 credit stress.
Probability Mapping (As of February 2026)
- Phase 1 continuation through mid-2026 remains meaningful.
- Phase 2 rotational compression probability is rising into late 2026.
- Early Phase 3 credit stress remains lower probability but increasing if spreads continue widening.
These probabilities are conditional and signal-dependent. They are not forecasts.
Confirmation vs Invalidation
Signals That Escalate Phase Pressure
- Further widening in technology credit spreads
- Financial sector breakdown
- Persistent negative gamma positioning
- Funding or repo strain
Signals That Extend the Current Phase
- Spread stabilization
- Breadth expansion
- Term premium compression
- AI monetization improving free cash flow metrics
Conclusion
Markets rarely break on headlines alone. They weaken when funding mechanics tighten and reflexivity turns negative. At present, funding signals are shifting but not snapping. Our Strategy therefore emphasizes monitoring transmission rather than predicting collapse.
Optionality and disciplined confirmation remain central to navigating late-cycle transitions.
Get the Daily Phase Brief
Signal changes, data releases to watch, and today’s regime assessment — delivered every morning before market open.
Join investors tracking the macro cycle. Unsubscribe anytime.
📊 Run Your Own Analysis
Use the BuildersLens 65-Signal Analyzer to see live macro positioning for tickers mentioned in this article:
This article is for educational and informational purposes only and does not constitute investment advice. Past performance is not indicative of future results. Consult with a qualified financial advisor before making investment decisions.