Research · Cycle Sequencing & Phases
The Correlation Break Behind the AI Trade Shift
The signal is not the headline. It is the correlation that broke.
Our Strategy treats markets as a sequencing problem, not a storytelling contest. In the source discussion, the most important claim is not a single forecast. It is the observation that a defining relationship inside the artificial intelligence trade may have shifted: higher artificial intelligence capital expenditure is no longer being rewarded by equity prices. That matters because the artificial intelligence complex has been priced, for multiple years, on the assumption that larger spending implies higher future monetization and higher future returns.
When the market starts to punish larger spending instead of reward it, it is often the first visible sign that investors are moving from expansion narratives toward return on investment skepticism. That is a regime transition signal, not a one day price move.
Framework mapping: where this fits in our five-phase cycle
We translate the discussion using Our Strategy’s five-phase operational lens:
Source: BuildersLens.com Signal Framework | Data as of March 08, 2026
- Phase 1: Melt-up participation, liquidity supportive, concentration can persist.
- Phase 2: Multiple compression and rotation, liquidity plateaus, valuations compress even if earnings are not collapsing.
- Phase 3: Breakdown and credit stress, funding constraints and refinancing risk dominate.
- Phase 4: Forced liquidity and policy collision, disorderly repricing and margin unwind behavior.
- Phase 5: Stabilization and accumulation, stress peaks then improves, breadth returns.
The core of this episode aligns most closely with Phase 2 pressure rising: valuations stretched, earnings momentum slowing, and the market becoming more sensitive to rates, financing conditions, and monetization proof. The discussion also outlines conditions that could accelerate a move into Phase 3 if credit and liquidity plumbing tighten.
Mechanism one: why higher capital spending can turn bearish
In Phase 1, capital spending is often interpreted as confidence. In late-cycle Phase 2, the same capital spending can be reinterpreted as:
- Cost inflation: data centers, power, chips, and memory inputs rise in price, so higher spending can buy less capacity than expected.
- Margin pressure: large outlays can compress free cash flow and force investors to reprice multiples.
- Prisoner dilemma spending: firms spend out of fear of losing share rather than because expected returns are high.
The key point is not whether spending is “good” or “bad.” The key is the market’s reaction function. When the reaction function flips, Phase 2 pressure increases because valuations become more fragile to disappointment.
Mechanism two: monetization bottlenecks are the transmission channel
The discussion highlights a practical constraint: revenue and cash flow need to catch up to narrative enthusiasm. When monetization is unclear, markets can stop paying for growth optionality and start demanding proof.
One example raised is the potential shift toward advertising-based models and the implied competitive collision in search and digital ads. Our Strategy’s translation is simple: this is not an isolated business model debate. It is a sign that the monetization stack is being stress-tested in public, which can reduce investors’ willingness to fund ever-expanding capital expenditure at premium multiples.
Macro transmission: lower growth with higher real rates
The interview frames a late-cycle risk mix: lower growth alongside higher real rates. Our Strategy treats this as a classic Phase 2 compression setup because it pressures valuation multiples even before earnings collapse.
In a higher real-rate regime, the market becomes less tolerant of long-duration cash flows that remain hypothetical. That is why the same “good news” can sell off: markets are repricing the discount rate and the certainty of future cash flows at the same time.
Date-anchored phase probabilities and sequencing
Our Strategy does not present this as certainty. We present phase pressure as probabilities with explicit timing windows:
- Current regime (late February 2026): Phase 2 pressure dominant, approximately fifty five percent probability through June 2026.
- Next phase risk: Phase 3 emergence, approximately thirty percent probability by June 2026, rising into the second half of 2026 if credit and funding stress confirm.
- Two phases out: Phase 4 forced-liquidity window, approximately fifteen percent probability by December 2026, conditional on disorderly credit widening and liquidity plumbing stress.
- Stabilization: Phase 5 accumulation becomes relevant after stress peaks and improves, more plausibly a 2027 discussion than a near-term assumption.
These are not forecasts. They are a disciplined way to express uncertainty and to prevent one narrative from becoming a single-point failure.
What changes vs what does not change
What changes
- The market’s reaction function to capital spending: if higher spending produces lower stock prices, leadership becomes fragile.
- The importance of proof: revenue, margins, and cash flow confirmation become more decisive than vision narratives.
- Rotation behavior: Phase 2 often expresses itself as churn and leadership swaps rather than immediate index collapse.
What does not change
- Sequencing discipline: correlations breaking increases the value of optionality and staged decision-making.
- Signal hierarchy: credit, funding, and liquidity plumbing still lead equities at turning points.
- Confirmation standards: we do not upgrade phase risk on one earnings headline or one data print.
Confirmations vs invalidations: the monitoring list
Our Strategy watches confirmation and invalidation through a small set of observable signal buckets:
Confirmations that Phase 2 is hardening into Phase 3
- Credit stress: high yield spreads widening and refinancing headlines increasing.
- Funding and liquidity plumbing: signs of funding strain and weaker auction dynamics.
- Dollar and global funding: persistent dollar strength that tightens global conditions.
- Breadth and concentration: narrowing leadership and repeated downside reactions to good earnings.
Invalidations that reduce late-cycle pressure
- Liquidity re-acceleration: sustained improvement in liquidity momentum rather than a brief bounce.
- Breadth recovery: broad participation rather than a few megacaps holding the index together.
- Return on investment proof: monetization and margins improving enough that the market rewards capital spending again.
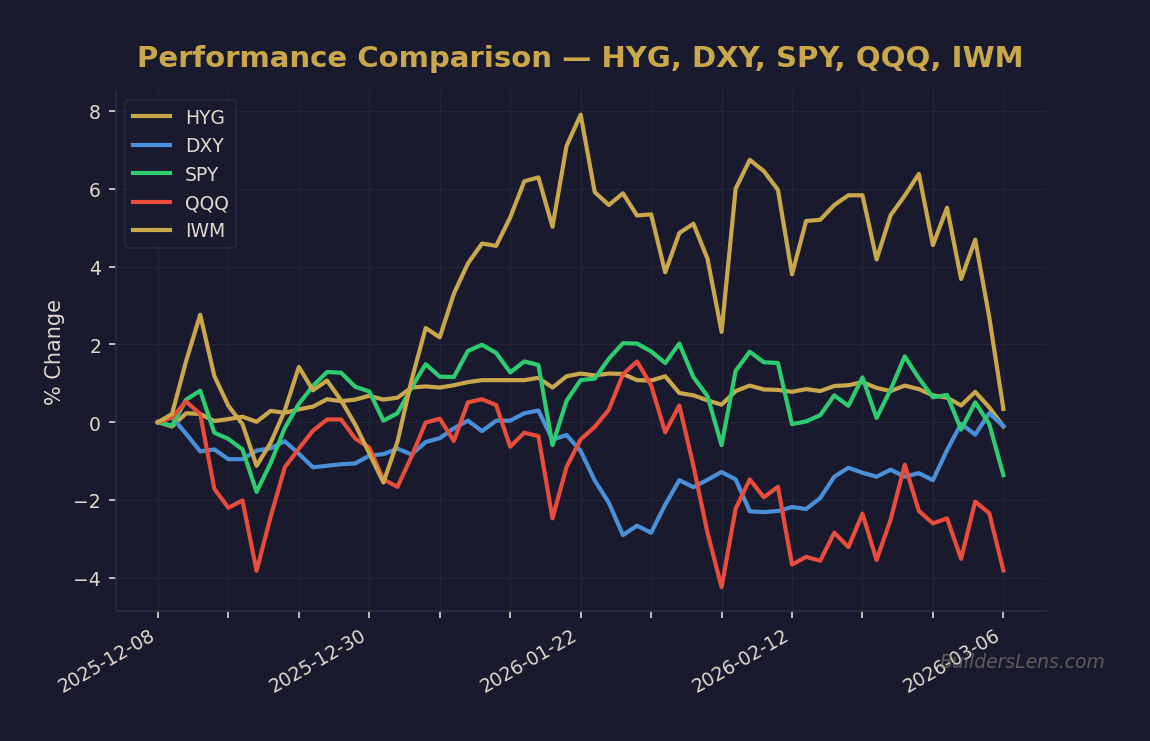
Observation-only tickers that often help organize these buckets include: SPY, QQQ, IWM, HYG, LQD, TLT, DXY, GLD, and BTC proxies. These are not signals by themselves; they are dashboards for monitoring the transmission channels discussed above.
Bottom line: the lesson of the correlation break
Our Strategy’s translation of this episode is not that artificial intelligence is over or that everything crashes. It is that a key correlation may be failing, and correlation failure is often how regimes change. If the market stops paying for spending and starts demanding cash flow, Phase 2 pressure increases, rotations intensify, and Phase 3 becomes a conditional risk that must be earned by credit and funding confirmations.
We remain mechanism-first, probability-weighted, and sequencing-driven. That is how we stay durable when narratives shift faster than signals.
Get the Daily Phase Brief
Signal changes, data releases to watch, and today’s regime assessment — delivered every morning before market open.
Join investors tracking the macro cycle. Unsubscribe anytime.
📊 Run Your Own Analysis
Use the BuildersLens 65-Signal Analyzer for live macro positioning:
→ Analyze HYG (High Yield Credit)
→ Analyze DXY (US Dollar Index)
This article is for educational and informational purposes only and does not constitute investment advice. Past performance is not indicative of future results. Consult with a qualified financial advisor before making investment decisions.