Research · Rates & Yield Curves
The Correlation Shift After February OPEX
February OPEX and Mortgage Rate Risk
As we approach a known volatility window, changing correlations deserve attention.
Source:
February OPEX and Mortgage Rate Risk – Aaron Montell (Macro to Mortgage)
Mortgage rates hovering near 6% have fueled hopeful narratives for spring housing. But when we zoom out and
look at market behavior around February options expiration (OPEX), the historical record argues for awareness.
Not because a calendar date “causes” volatility—but because mechanical positioning resets can interact with
thin liquidity and shifting macro regime dynamics.
Source: BuildersLens.com Signal Framework | Data as of March 08, 2026
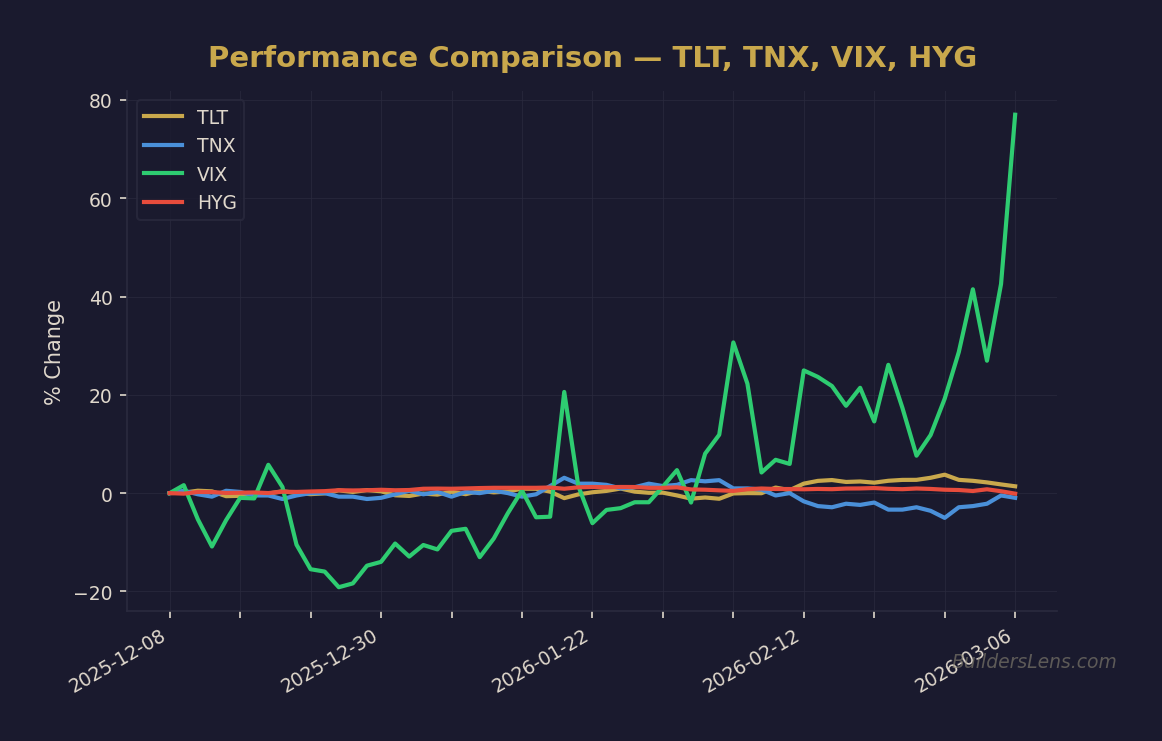
This write-up uses TLT (long-duration Treasury ETF) as a consistent proxy for long-end rate behavior, given the
directional relationship between mortgage rates and the 10-year Treasury.
Our Strategy Overlay
Strategy Anchor
In Our Strategy, we are probability-based and confirmation-driven. We do not trade seasonal stories.
We track signals, map them into phases, and focus on transmission—how positioning, liquidity, and credit
mechanics propagate into rates and risk assets.
What This Blog Is Actually Claiming
The core claim is that February OPEX has historically preceded a volatility window into early March, and that
the traditional “risk-off = bond rally = lower yields” reflex has become less reliable since 2022 because
stock/bond correlations have shifted.
Signal Classification (Our Strategy Buckets)
- Breadth / Positioning / Options reflexivity: OPEX dealer hedging and post-expiration unwind dynamics.
- Yield direction / Term premium: long-duration rates behaving differently post-2022.
- Liquidity plumbing (market microstructure): thinner liquidity post-OPEX amplifying moves.
- Risk regime / correlation: stocks and bonds no longer reliably offset one another.
Mechanism (Plain-English Transmission)
OPEX is a mechanical reset. Into expiration, dealers hedge option exposure. That hedging can suppress or shape
price movement. When contracts expire, hedges can unwind quickly, and liquidity can thin.
In the old regime, equity weakness after OPEX often pulled capital into long Treasuries. That lowered yields and
improved mortgage rate sheets. In the post-2022 regime, that hedge function is less consistent because the bond
market is also repricing inflation risk, fiscal supply, and term premium. When term premium is rising, bonds can
sell off even when equities wobble.
Phase Mapping (Five-Phase Model)
This setup most cleanly maps to late Phase 1 (Melt-Up / Complacency With Cracks) drifting toward
Phase 2 (Multiple Compression / Rotation).
- Why Phase 1 is still plausible: indices can look stable even as internal stress builds.
-
Why Phase 2 pressure rises: correlation instability reduces the reliability of bonds as a hedge,
increasing the system’s sensitivity to positioning shocks. - What this does NOT confirm: it does not, by itself, confirm Phase 3 credit stress or Phase 4 forced liquidity.
Probability & Timing Impact (Conditional, Date-Anchored)
We express this as phase pressure, not prediction.
-
Now through March 2026: ~50% Phase 1 continuation (choppy grind), ~35% Phase 2 volatility expansion,
~15% early Phase 3 acceleration (requires credit/funding confirmation). - By June 2026: Phase 2 probability rises if bond/equity correlation remains unstable and yields refuse to fall on equity weakness.
- By December 2026: Phase 3 risk rises if correlation instability coincides with widening credit spreads and labor deterioration.
-
By June 2027: Phase 3–4 outcomes become more plausible only if forced-liquidity signals appear
(funding stress, disorderly auctions, sustained credit widening).
What Changes in Our Strategy (Process Only)
- We demote “flight to safety” from rule to conditional signal.
- We elevate correlation behavior (stocks vs duration) as a monitoring input.
- We treat volatility windows as sensitivity tests, not forecasts.
- We tighten confirmation standards before assuming “rates will fall if stocks fall.”
What Does NOT Change
- We do not trade calendar folklore as a standalone edge.
- We keep optionality central; we do not force exposure.
- We require multi-signal confirmation before escalating phase classification.
- We keep deployment tranche-based; no single decision is allowed to be fatal.
Action Checklist (Signals to Watch)
- Correlation check: do bonds rally during equity drawdowns, or do they sell off as well?
- Volatility structure: VIX making higher highs/lows vs index stability.
- Yield behavior: 10-year/long-end yields refusing to fall when equities weaken.
- Term premium/auction tone: weak demand, tails, or persistent upward pressure on duration.
- Breadth: narrowing leadership and failed rebounds after volatility spikes.
Invalidation Checklist
- Stocks down consistently coincides with bonds up (stable negative correlation returns).
- Long-end yields decline during equity stress (term premium pressure eases).
- Volatility compresses sustainably post-OPEX while breadth improves.
Understanding Monthly Options Expiration (OPEX)
Every third Friday, large equity option exposure expires. Dealers hedge dynamically into expiration,
which can stabilize price action. When options roll off, hedges unwind and liquidity can thin, making markets
more sensitive to marginal flows.
Two fast changes often follow:
- Hedge unwinds remove mechanical support.
- Liquidity thins, amplifying moves.
In plain English: OPEX can create a short window where yields and rate sheets move in ways that feel random—
but are often positioning-driven.
February as a “Hidden” Volatility Window
February has historically seen volatility firm into OPEX and often peak in Q1 near or shortly after the event.
The blog notes that, over the past two decades, equities were lower by the first Friday of March versus the
February OPEX close about 65% of the time.
The key question for mortgage rate risk is not whether equities dip, but whether bonds still behave as a
stabilizer if that dip occurs.
The Old Normal (2006–2021): The Reliable Hedge
In the pre-2022 regime, equities and long-duration Treasuries tended to be negatively correlated.
Equity weakness often produced a bond rally, which lowered yields and improved rate sheets.
- Stocks down → volatility up
- Bonds up → yields down
- Mortgage rates improve
The New Normal (2022–Present): Correlation Flip Risk
Since 2022, the stock/bond relationship has been less reliable, at times shifting positive.
In this regime, stocks and bonds can fall together as term premium and inflation risk dominate.
That changes the risk math for anyone assuming equity weakness automatically brings mortgage relief.
Conclusion
February OPEX is a useful stress test window. But the deeper takeaway is structural: correlation regimes change.
When they do, the “old normal” playbook can fail precisely when people need it most.
Original blog reference:
February OPEX and Mortgage Rate Risk – Macro to Mortgage
This is educational content only and not financial advice.
Get the Daily Phase Brief
Signal changes, data releases to watch, and today’s regime assessment — delivered every morning before market open.
Join investors tracking the macro cycle. Unsubscribe anytime.
📊 Run Your Own Analysis
Use the BuildersLens 65-Signal Analyzer for live macro positioning:
→ Analyze HYG (High Yield Credit)
This article is for educational and informational purposes only and does not constitute investment advice. Past performance is not indicative of future results. Consult with a qualified financial advisor before making investment decisions.