Research · Credit & Liquidity
The Hidden Credit Risk Inside U.S. Manufacturing

Manufacturing Fragility and Credit Risk Beneath the Surface
Supply chains appear stable at the headline level. Factories are running. Inventories are rebuilding. Production metrics look normalized compared to the pandemic shock. But when we step inside the structure of U.S. manufacturing, the signal becomes more nuanced.
In Our Strategy, we do not focus on headlines. We focus on transmission. And manufacturing is a transmission channel for credit, liquidity, and phase transitions.
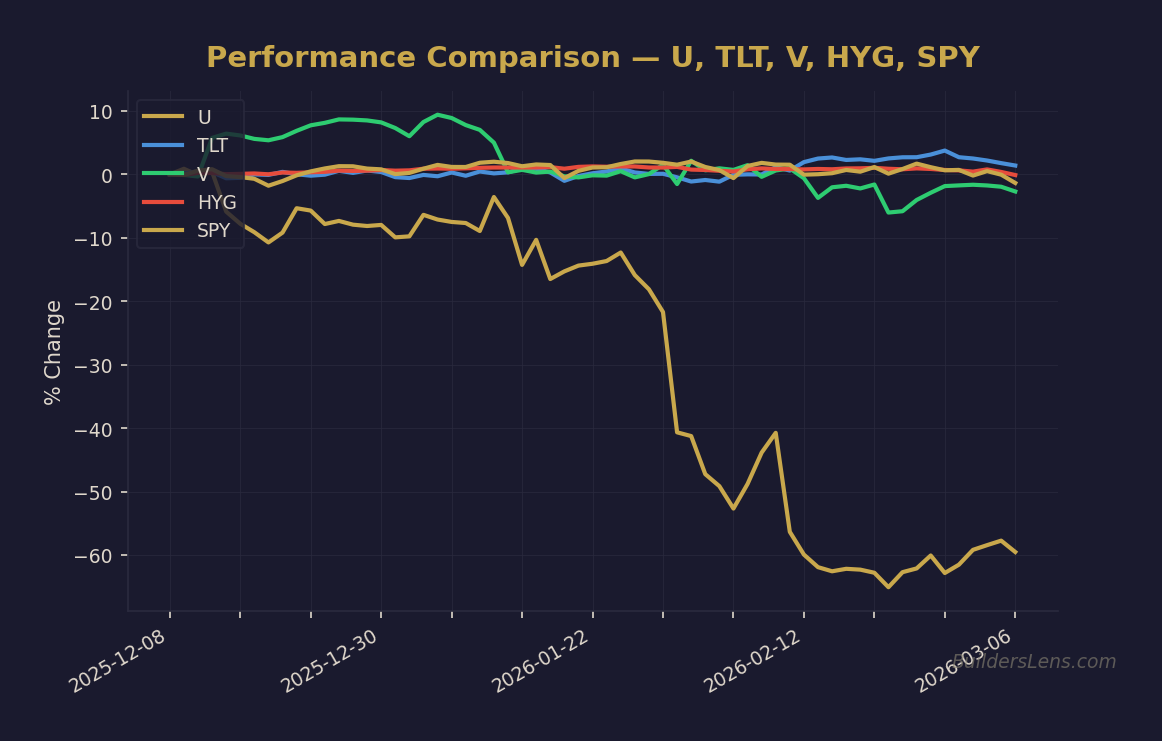
Source: BuildersLens.com Signal Framework | Data as of March 08, 2026
What Changed After the Pandemic
The shift from “just-in-time” to “just-in-case” inventory represents more than operational adjustment. It reflects a system that experienced fragility and responded by increasing buffer stock.
Large corporations had the capital to front-run tariffs and stockpile inventory. Small and mid-size manufacturers often did not. This divergence matters because roughly three-quarters of U.S. manufacturing capacity sits in small to mid-size firms.
That base layer is where structural strain accumulates.
The Capital Constraint Problem
Automation and modernization require affordable capital. With financing costs elevated, many smaller manufacturers are deferring equipment upgrades. In some cases, they are operating machinery decades old because full replacement is not financially viable.
This is not immediately visible in equity indices. Large-cap firms can absorb higher input costs and borrow more efficiently. But when capital access tightens at the small and mid-size layer, supply elasticity weakens.
Reduced elasticity increases vulnerability during demand shocks.
Credit Transmission Mechanism
The transmission path is sequential:
- Input costs rise due to tariffs or supply concentration.
- Smaller firms face margin compression.
- Capital expenditures slow.
- Productivity stalls.
- Lead times lengthen.
- Downstream manufacturers experience delays.
- Prices rise or availability declines for end consumers.
Credit is the fulcrum in this sequence. When capital becomes constrained, fragility compounds beneath surface stability.
Phase Mapping in Our Strategy
This environment aligns most closely with rising Phase 2 pressure in our five-phase framework.
Liquidity has plateaued. Financing costs remain restrictive. Valuations can remain elevated while underlying capacity strain increases.
This does not confirm a Phase 3 breakdown. But it raises sensitivity to credit spreads, funding markets, and yield direction.
What We Monitor From Here
- High-yield credit spreads.
- Small-business lending surveys.
- Manufacturing lead times.
- Engineering employment trends.
- Treasury auction strength and term premium behavior.
If credit conditions tighten while manufacturing capex slows further, Phase 3 transition probabilities rise.
What Changes and What Does Not
What changes: We increase monitoring of credit-sensitive segments of the industrial base. Optionality remains valuable. Risk discipline becomes more important beneath index strength.
What does not change: We do not predict collapse without confirmation. Melt-up participation remains valid with defined exits. Duration convexity remains conditional on yield rollover.
Credits
This analysis references insights from:
- Verified Investing — Verified Market Insiders
- Interview featuring Patty Gander
- Original discussion available at: https://youtu.be/57MrSEgHmcU?si=b4Qzl-jni293hqWv
This article reflects Our Strategy’s probability-based framework and is provided for educational purposes only.
Sponsor
This research is made possible by our sponsor, V6D. Their support allows us to continue producing independent, probability-based macro strategy research focused on disciplined cycle analysis and risk sequencing.
We do not need to be early. We just cannot afford to be late.
Get the Daily Phase Brief
Signal changes, data releases to watch, and today’s regime assessment — delivered every morning before market open.
Join investors tracking the macro cycle. Unsubscribe anytime.
📊 Run Your Own Analysis
Use the BuildersLens 65-Signal Analyzer for live macro positioning:
→ Analyze HYG (High Yield Credit)
This article is for educational and informational purposes only and does not constitute investment advice. Past performance is not indicative of future results. Consult with a qualified financial advisor before making investment decisions.