Research · Credit & Liquidity
The Housing Reset May Already Be Quietly Starting

Housing Market Stress Signals: Mechanisms Beneath the Surface
The housing market is often analyzed through price trends or headlines. Our Strategy approaches housing differently. Housing is a transmission mechanism within the broader macro system. It connects labor markets, credit availability, interest rates, and household balance sheets.
When pressure develops across those channels simultaneously, housing becomes a powerful amplifier of financial stress. Recent developments in multifamily financing and rent trends suggest that early phase pressure may already be forming.
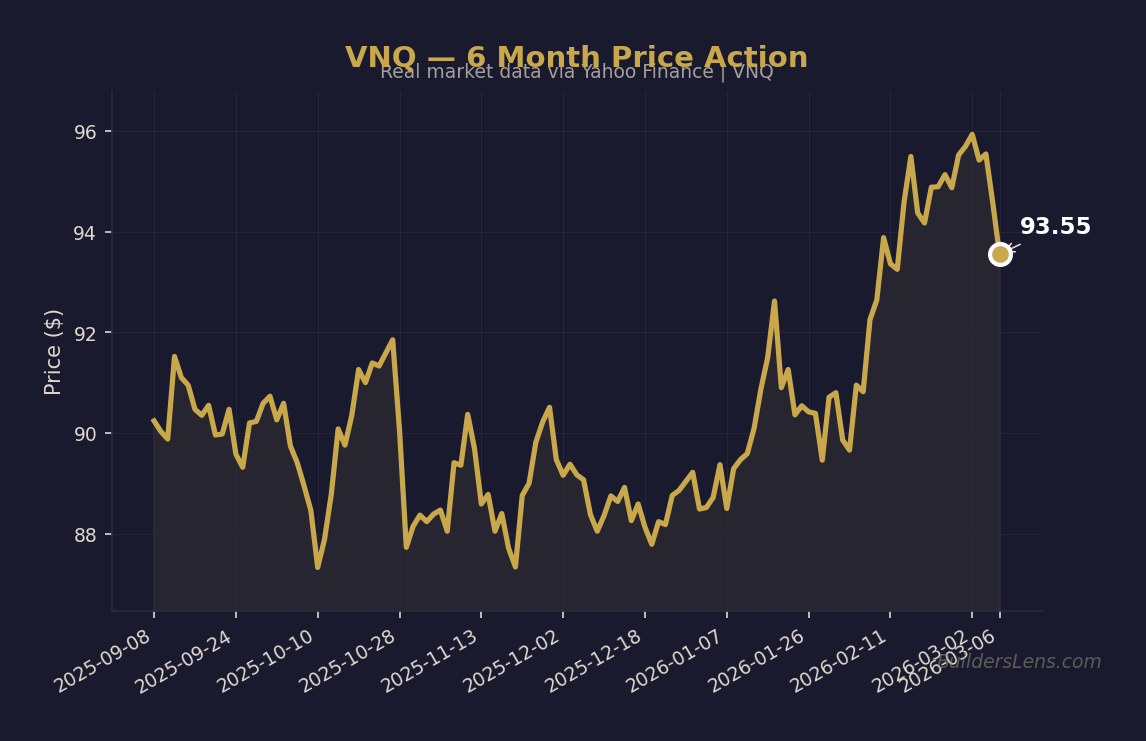
Source: BuildersLens.com Signal Framework | Data as of March 08, 2026
Multifamily Refinancing Pressure
A significant volume of multifamily loans issued during the low-rate period of the early twenty twenty decade is approaching maturity. These loans were frequently underwritten with expectations of rising rents and stable financing costs.
Today refinancing occurs in a dramatically different environment. Borrowing costs remain elevated compared with earlier financing conditions, while rent growth has slowed or reversed in several metropolitan areas.
When operating income fails to support refinancing at higher rates, owners face limited choices.
- Inject additional capital
- Accept lower property valuations
- Sell assets into weaker demand
- Negotiate restructuring with lenders
This refinancing dynamic represents a mechanical stress channel rather than a narrative driven market event.
Supply Expansion and Rent Compression
Recent years produced a large wave of apartment construction across major United States cities. Many of these developments targeted higher income tenants and premium rental segments.
When supply increases rapidly while economic growth slows, rent compression often follows. Several metropolitan areas are already experiencing declining rents or increased concessions such as free months of occupancy.
This dynamic weakens property cash flow at the same moment financing costs rise.
Phase Mapping Within Our Strategy Framework
Current Phase: Late Phase One Structural Pressure
Our Strategy currently classifies housing within a late Phase One environment. In this phase markets appear relatively stable while structural pressure builds beneath the surface.
- Slowing transaction activity
- Rising refinancing difficulty
- Localized distress rather than systemic decline
- Gradual rent compression in oversupplied markets
Potential Transition: Phase Two Forced Liquidity
If refinancing stress accelerates alongside labor market deterioration and credit tightening, housing could transition into Phase Two conditions. Phase Two represents a forced liquidity environment where asset sales occur due to financing constraints rather than sentiment shifts.
Policy Stabilization Phase
Historically housing downturns often precede policy stabilization responses. These may include liquidity facilities, lending adjustments, or fiscal housing programs.
Probability Timeline Within the Strategy Framework
Late Phase One Continuation
Approximately sixty to seventy percent probability that housing remains in a slow adjustment phase through the second half of twenty twenty six. This period may feature declining rents in oversupplied regions and increasing refinancing negotiations.
Phase Two Probability Window
Approximately forty percent probability that refinancing stress expands into a broader credit event between late twenty twenty six and mid twenty twenty seven.
Policy Stabilization Phase
If systemic pressure emerges policy response mechanisms historically appear within the subsequent twelve to eighteen months following credit stress escalation.
Key Monitoring Signals
Within Our Strategy framework the following signals determine whether housing pressure remains contained or escalates into broader systemic risk.
- Labor market stability and hiring trends
- Credit spreads and private credit performance
- Regional bank exposure to commercial real estate
- Multifamily refinancing activity and loan restructuring
- Rent growth across major metropolitan areas
- Long term interest rate behavior
What Changes and What Does Not Change
What Changes
- Financing conditions for multifamily properties
- Rent growth expectations
- Capital availability for leveraged property owners
What Does Not Change
- Housing remains a long cycle asset class
- Population demand continues to support long term occupancy
- Institutional capital historically enters after forced repricing phases
Invalidation Conditions
The current analysis would require reassessment if the following signals occur.
- Rapid decline in long term borrowing costs enabling easy refinancing
- Strong reacceleration of rent growth across major metropolitan areas
- Significant easing of bank lending standards for commercial real estate
Conclusion
The housing market rarely transitions from stability to crisis instantly. Instead pressure accumulates through financing structures and credit conditions before prices visibly adjust.
Current developments in multifamily refinancing, rent compression, and capital market tightening suggest that the system may be entering an early structural adjustment phase. Whether this remains contained or evolves into a broader forced liquidity event will depend on labor conditions, credit availability, and interest rate dynamics over the coming quarters.
📊 Run Your Own Analysis
Use the BuildersLens 65-Signal Analyzer to see live macro positioning for tickers mentioned in this article:
This article is for educational and informational purposes only and does not constitute investment advice. Past performance is not indicative of future results. Consult with a qualified financial advisor before making investment decisions.