Research · Narrative Translation
The Pattern That Appears Before Financial Crises
Our Strategy translation: three collapses, three different failure mechanisms
This source video is framed as lived experience across three major market drawdowns: the Savings and Loan era, the dot com bust, and the Global Financial Crisis. Our Strategy does not treat these as “stories.” We treat them as three distinct transmission pathways that can each drive a crash cascade.
The durable lesson is not that crises “repeat.” The durable lesson is that markets break when a specific mechanism forces liquidation or repricing. Headlines usually arrive after the mechanism has already moved prices.
Mechanism one: rate shock and balance sheet mismatch
The first collapse described in the video is fundamentally a balance sheet mismatch problem. When inflation rises and policy rates rise rapidly, deposit costs increase while loan books remain locked into lower long-term rates.
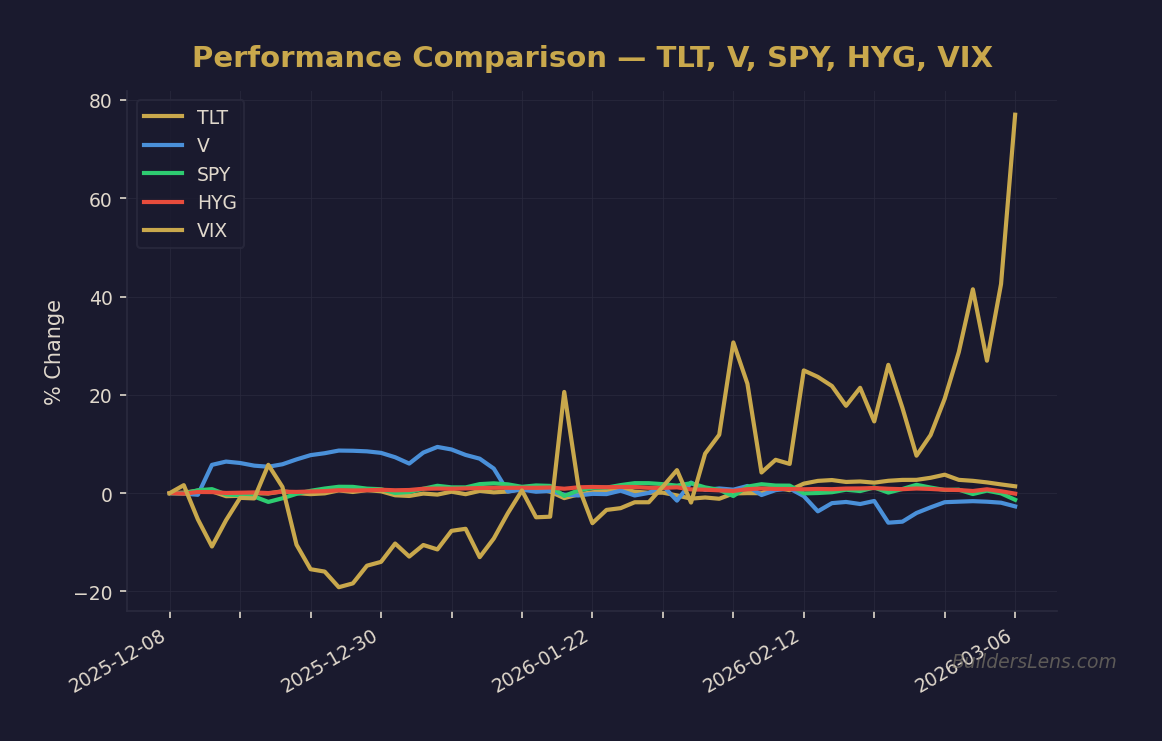
Source: BuildersLens.com Signal Framework | Data as of March 08, 2026
This creates negative carry for banks. Depositors demand higher yields while banks are still earning lower yields on older loans. Over time this compresses margins and can produce solvency stress.
Borrowers face the same pressure. When loans mature and refinancing becomes necessary, higher rates can make refinancing impossible. Defaults then rise and credit conditions tighten.
In Our Strategy’s framework, this dynamic often represents the transition from late Phase 1 conditions toward Phase 2 and Phase 3 pressures.
Mechanism two: speculative paper asset repricing
The second collapse described is the dot com crash, which was primarily a speculative paper-asset bubble. In these environments capital flows toward narratives rather than profitability.
Technology optimism and growth expectations drive valuations far above fundamental earnings power. Prices rise because investors expect future growth rather than because current cash flow supports the valuation.
Once expectations shift, the marginal buyer disappears. Without new buyers supporting higher prices, valuations compress quickly.
Within our framework this type of event often appears as a Phase 1 melt-up followed by Phase 2 multiple compression.
Mechanism three: housing and credit reflexivity
The Global Financial Crisis provides a different mechanism. Housing and credit markets became tightly linked through low interest rates, expanding mortgage credit, and rising collateral values.
Low borrowing costs encouraged more buyers. Rising home prices increased collateral values. Higher collateral values supported additional lending. This created a reinforcing feedback loop.
When affordability limits appeared and mortgage defaults began to rise, the loop reversed. Housing supply increased through foreclosures while credit tightened simultaneously.
Because housing connects consumers, banks, and collateral values, the feedback loop amplified financial instability.
Framework mapping: the five phase cycle
Phase one: melt up with hidden stress
Asset prices remain strong while underlying financial conditions gradually tighten.
Phase two: valuation compression
Markets begin to stall as valuations adjust to tighter liquidity and higher rates.
Phase three: credit stress emerges
Credit spreads widen, refinancing becomes more difficult, and lending standards tighten.
Phase four: forced liquidity events
Volatility rises and forced sellers begin to drive price movements.
Phase five: stabilization
Credit conditions stabilize and new accumulation phases begin.
What we monitor
Rather than attempting to predict exact turning points, Our Strategy focuses on confirming signals.
- Credit spreads widening
- Bank lending standards tightening
- Weak Treasury auction demand
- Rising consumer delinquencies
- Housing moving from frozen transactions toward distress
These signals help identify when pressure inside the financial system may be building.
Closing perspective
Financial crises rarely emerge from a single cause. They are usually the result of several mechanisms interacting through time.
Understanding the sequence of events that precede major corrections can help investors interpret market conditions with greater clarity.
Educational and non advisory disclaimer: This research style analysis is for informational and educational purposes only and does not constitute investment advice.
📊 Run Your Own Analysis
Use the BuildersLens 65-Signal Analyzer to see live macro positioning for tickers mentioned in this article: