Research · Credit & Liquidity
The Private Credit Signal Markets May Be Ignoring

Private Credit Stress and the Early Signals of Credit Cycle Reversal
The recent redemption restrictions announced by Blue Owl triggered widespread comparisons to the early stages of the two thousand seven credit crisis. While historical comparisons can be useful context, the more important task is understanding the mechanism being revealed.
Credit cycles rarely break suddenly. They evolve through sequences of liquidity mismatches, investor behavior changes, and asset correlation shifts that gradually transition markets from expansion to contraction.
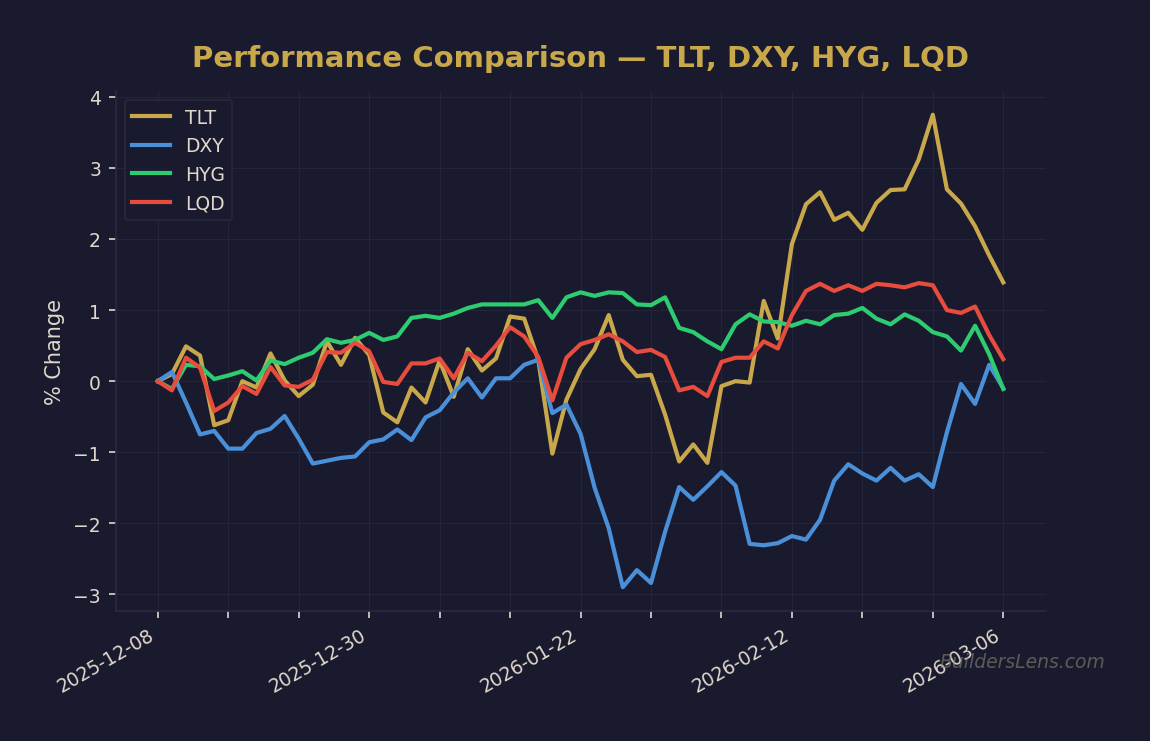
Source: BuildersLens.com Signal Framework | Data as of March 08, 2026
The Mechanism: Liquidity Promises vs Asset Liquidity
Private credit funds typically promise periodic redemption windows while investing in relatively illiquid loans. During expansion phases this structure functions smoothly because capital inflows exceed redemption requests.
When risk perception changes, however, investors attempt to withdraw capital simultaneously. If underlying assets cannot be sold quickly without losses, funds impose redemption restrictions or “gates.”
This is not simply a liquidity management decision. It reveals a structural mismatch between perceived liquidity and actual liquidity.
Credit Transmission Channels
Once one fund restricts withdrawals or begins selling assets, the psychological transmission mechanism begins:
- Investors reassess liquidity assumptions across similar funds.
- Publicly traded private credit managers experience equity declines.
- Closed-end funds tied to structured credit vehicles reduce distributions.
- Leveraged loan markets weaken as buyers step back.
This behavior increases correlations across credit assets that historically moved independently.
Correlation Shifts as Systemic Signals
One of the most important signals in credit downturns is correlation convergence. Assets marketed as uncorrelated begin moving together as investors prioritize liquidity over yield.
This shift has begun appearing in leveraged loan indexes, collateralized loan obligation vehicles, and private credit equities.
When correlation increases across multiple credit structures, the system reveals that investors are reducing exposure across the entire risk spectrum.
Treasury Market Confirmation
At the same time, Treasury markets are showing early bull steepening characteristics. Short-term rate expectations are drifting lower while longer-term yields remain more stable.
This dynamic reflects the market beginning to price weaker growth or easier monetary policy ahead.
Within Our Strategy framework, this development falls inside the yield dynamics pillar of the crash cascade dashboard.
Framework Mapping: Our Strategy Phase Model
Current Phase: Phase 1 – Melt-Up with Structural Cracks
Probability of continuation through June 2026: approximately sixty percent.
Characteristics include resilient asset prices combined with growing credit stress beneath the surface.
Next Phase Risk: Phase 2 – Forced Liquidity Events
Probability by December 2026: approximately thirty percent.
This phase would require broader forced selling across credit markets and widespread redemption pressures.
Subsequent Phase: Phase 3 – Policy Response
Probability by June 2027: approximately twenty percent.
This phase would involve central bank liquidity responses once credit stress spreads into broader financial markets.
Longer-Term Phase: Phase 4 – Real Asset Repricing
Probability by late twenty twenty seven: approximately fifteen percent.
This phase typically follows policy stabilization and reflects a structural shift toward commodities and real assets.
What Changes vs What Does Not Change
What Changes
- Private credit liquidity assumptions are being challenged.
- Investor risk tolerance inside credit markets is declining.
- Correlation across structured credit vehicles is increasing.
What Does Not Change
- Systemic scale remains limited relative to two thousand seven.
- Policy response mechanisms remain available.
- Most credit markets remain operational and liquid.
Monitoring Signals
- High-yield credit spreads
- Leveraged loan index behavior
- Private credit BDC valuations
- Treasury yield curve dynamics
- Dollar funding conditions
- Equity breadth and volatility regimes
Invalidation Conditions
This analysis would weaken if the following occur:
- Private credit funds resume normal redemptions without asset sales.
- Credit spreads tighten and leveraged loan demand stabilizes.
- Correlation across credit assets declines as investors re-enter risk markets.
Conclusion
The comparison to two thousand seven is less about predicting a crisis and more about recognizing a familiar credit cycle sequence.
Liquidity mismatches appear first. Investor behavior shifts second. Correlations rise third.
Only later do policy responses and systemic outcomes become clear.
At the moment, markets appear to be transitioning through the earliest stage of that sequence.
📊 Run Your Own Analysis
Use the BuildersLens 65-Signal Analyzer to see live macro positioning for tickers mentioned in this article:
→ Analyze HYG (High Yield Credit)
This article is for educational and informational purposes only and does not constitute investment advice. Past performance is not indicative of future results. Consult with a qualified financial advisor before making investment decisions.