Research · Narrative Translation
The UK Government Fell — But Labor Was the Real Signal

The UK Government Fell — But Labor Was the Real Signal
Political instability rarely begins in parliament. It begins in payrolls.
In Our Strategy, we do not frame this episode as a partisan shift. We frame it as a late-cycle transmission event. The UK’s rapid political deterioration is not the cause of economic weakness. It is the confirmation of it.
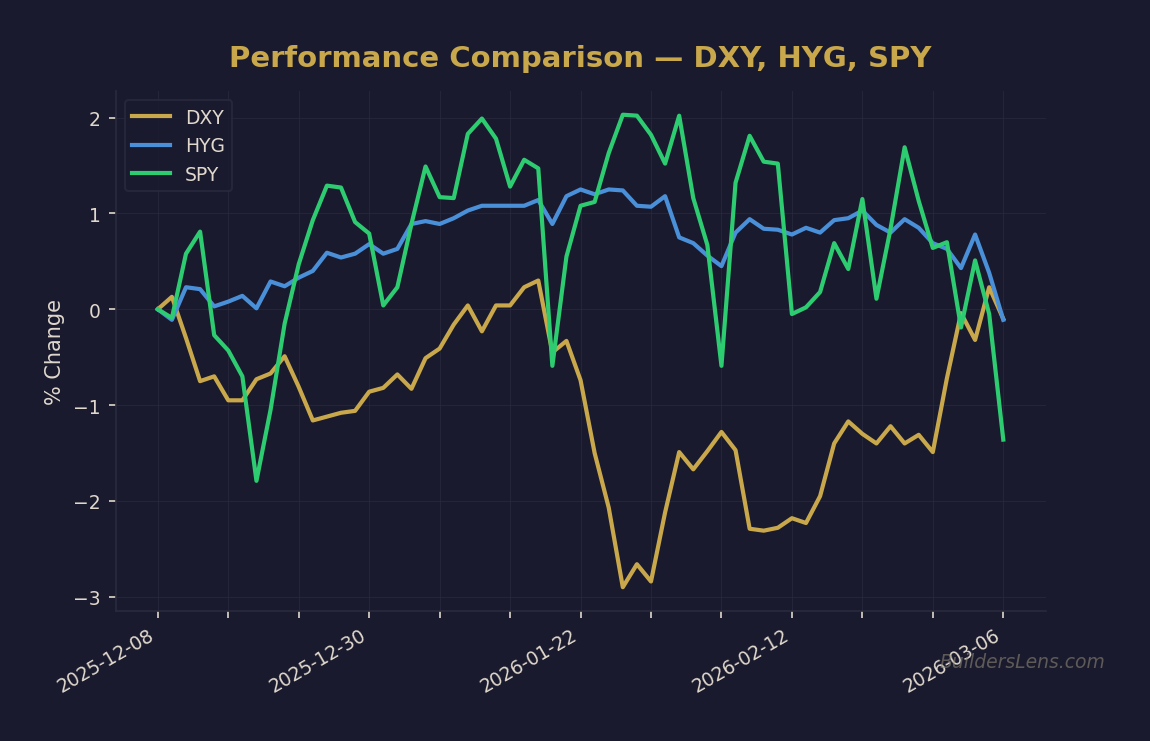
Source: BuildersLens.com Signal Framework | Data as of March 08, 2026
Strategy Anchor
We operate within a five-phase macro framework that prioritizes sequencing over timing and probabilities over conviction. Political instability tends to accelerate when labor markets weaken beneath headline growth stability. That is the structural signal under review.
What Actually Changed
Headline GDP remained marginally positive. Equity markets did not collapse. But payroll growth deteriorated, unemployment rose, and household pressure intensified. The economic rate of change slowed while political volatility accelerated.
This divergence is typical of late Phase 1 drifting into Phase 2.
Signal Classification
- Labor: Payroll losses and rising unemployment.
- Credit Quality: GDP insufficient to sustain employment stability.
- Liquidity Divergence: Asset prices resilient while households weaken.
- Policy Delay Overlay: Messaging suggests improvement while structural pressures persist.
Transmission Mechanism
Labor softens. Income confidence erodes. Consumption weakens. Business investment hesitates. Credit risk begins to migrate. Political dissatisfaction rises.
Markets can ignore this temporarily because liquidity supports asset prices. But labor deterioration historically precedes credit stress, not vice versa.
Phase Mapping
Current configuration aligns with late Phase 1 transitioning toward Phase 2:
- Index stability with internal fragility.
- Rising political volatility.
- Declining policy credibility.
This does not yet confirm Phase 3. Funding markets have not fractured. Credit spreads have not structurally widened. But probability density is shifting forward.
Probability Timeline
Next 3 Months
- Phase 1 stability: 45–55%
- Phase 2 drift: 35–45%
- Disorderly transition: 10–20%
Next 6 Months
- Phase 2 dominant regime: 45–55%
- Phase 3 transition risk: 25–35%
- Melt-up extension: 20–30%
Next 12 Months
- Phase 3 probability rises toward 35–45% if labor deterioration persists.
What Changes in Our Strategy
- Elevated weight on labor confirmation signals.
- Tighter participation discipline in late-cycle rallies.
- Optionality prioritized over conviction.
- Increased monitoring of credit spread behavior.
What Does Not Change
- We do not treat political events alone as crash signals.
- We do not abandon participation while liquidity remains supportive.
- We do not collapse probabilities into certainty.
- We do not confuse delay with resolution.
Monitoring Signals
- Unemployment trend acceleration.
- High-yield credit spreads.
- Housing delinquency data.
- Equity breadth deterioration.
- Dollar funding stress.
Invalidation Conditions
- Labor stabilizes across multiple reports.
- Credit spreads compress despite rising unemployment.
- Wage growth sustainably exceeds inflation.
- Political volatility fails to impact business investment.
Political instability is rarely the beginning of the cycle. It is usually a visible consequence of deeper economic pressure.
We do not need to be early. We just cannot afford to be late.
Get the Daily Phase Brief
Signal changes, data releases to watch, and today’s regime assessment — delivered every morning before market open.
Join investors tracking the macro cycle. Unsubscribe anytime.
📊 Run Your Own Analysis
Use the BuildersLens 65-Signal Analyzer for live macro positioning:
→ Analyze HYG (High Yield Credit)
This article is for educational and informational purposes only and does not constitute investment advice. Past performance is not indicative of future results. Consult with a qualified financial advisor before making investment decisions.