Research · Narrative Translation
When Falling Yields Stop Helping Stocks

The Quiet Regime Shift Markets Are Pricing In
This discussion is not about predicting a dramatic crash. It is about identifying a structural shift in market behavior.
Headlines focus on tariffs, geopolitical tensions, oil spikes, and crypto volatility. But Our Strategy prioritizes mechanisms over narratives. The deeper mechanism currently unfolding is late-cycle compression.
When Falling Yields Stop Helping Stocks
For much of the past cycle, falling yields were bullish for equities. Lower rates implied easier liquidity, stronger multiples, and supportive policy expectations.
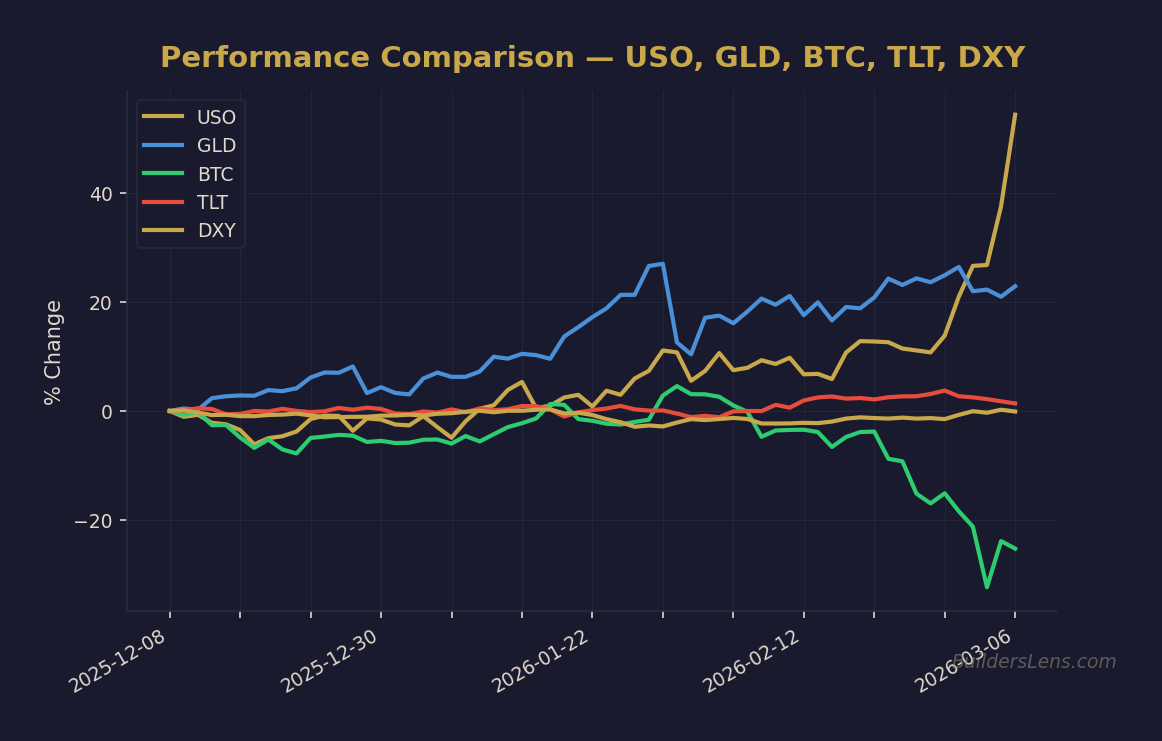
Source: BuildersLens.com Signal Framework | Data as of March 08, 2026
That relationship is now showing signs of inversion.
If yields fall because growth expectations weaken while inflation remains constrained, the signal changes. It no longer implies stimulus. It implies pressure. That is a regime transition.
Late-Cycle Compression: The Core Mechanism
Compression phases are rarely explosive at first. They tend to unfold through:
- Narrowing leadership
- Rising cross-asset correlations
- Repeated failed breakouts
- Rebounds that lose momentum more quickly
Index stability can mask internal deterioration. That is why breadth and credit matter more than headline volatility.
Cross-Asset Signals
Gold
Gold strength reflects hedging demand and monetary constraint awareness. It is not automatically a prediction of collapse, but it signals positioning defensively against policy limits.
Oil
Oil firmness keeps inflation constraints alive. Persistent energy strength reduces the probability of aggressive policy easing if growth slows.
Bitcoin
Bitcoin remains highly liquidity-sensitive. Sentiment extremes can produce sharp relief rallies. But relief is not resolution. Durability depends on broader liquidity stabilization.
Equities
The risk scenario is not necessarily a sudden crash. It is the possibility of prolonged sideways volatility where valuations compress while inflation erodes real returns.
Phase Mapping: Where We Are
Our Strategy currently frames the environment as late Phase One with rising Phase Two pressure.
This suggests rotation and compression rather than systemic fracture — for now.
However, transition risk rises if we observe:
- Persistent widening in credit spreads
- Weak Treasury auction demand
- Funding market instability
- Dollar strength coinciding with equity weakness
Date-Anchored Probabilities
- Now through mid 2026: Approximately sixty percent probability of continued rotation and compression with elevated volatility but orderly funding.
- Mid 2026 through late 2026: Roughly thirty five percent probability of clearer Phase Two compression if breadth and credit weaken.
- Into 2027: Around twenty percent probability of Phase Three credit transmission if refinancing stress intensifies.
These are conditional probabilities, not forecasts. They evolve as confirmations or invalidations appear.
Japan-Style Risk: A Grind, Not a Crash
A common misconception is that risk must arrive dramatically.
History shows another path: prolonged sideways markets with periodic twenty to forty percent drawdowns, followed by incomplete recoveries.
In such regimes, the real risk is time compression rather than one-day collapse.
What Confirms or Invalidates the Thesis
Confirmations
- Credit spreads widen persistently
- Equity rallies fail with narrowing breadth
- Funding conditions tighten
Invalidations
- Credit remains contained during equity pullbacks
- Breadth expands meaningfully
- Funding markets remain orderly despite volatility
Optionality Over Conviction
The objective is not dramatic prediction. It is structured adaptation.
Compression regimes reward flexibility and punish certainty.
Sequence matters more than speed. Mechanisms matter more than headlines.
Educational Disclaimer
This content is for informational and educational purposes only and does not constitute financial or investment advice. Markets involve risk and uncertainty.
Get the Daily Phase Brief
Signal changes, data releases to watch, and today’s regime assessment — delivered every morning before market open.
Join investors tracking the macro cycle. Unsubscribe anytime.
📊 Run Your Own Analysis
Use the BuildersLens 65-Signal Analyzer to see live macro positioning for tickers mentioned in this article:
→ Analyze TLT (Long-Term Treasuries)
This article is for educational and informational purposes only and does not constitute investment advice. Past performance is not indicative of future results. Consult with a qualified financial advisor before making investment decisions.