Research · Credit & Liquidity
When Liquidity Stops Being Smooth
When Liquidity Stops Being Smooth
In Our Strategy, we focus less on where markets are going and more on
how risk is delivered. This distinction becomes most important late in
cycles, when liquidity does not vanish but begins to behave differently.
The risk is not the absence of support. It is the transition from
continuous liquidity to intermittent liquidity.
What the Source Video Is Actually Claiming
The source video argues that markets may be exiting a smooth liquidity regime.
Gold’s sharp drawdown, elevated cash balances, and muted volatility suggest that
capital is no longer rotating cleanly between assets. Instead, it is increasingly
choosing to wait.
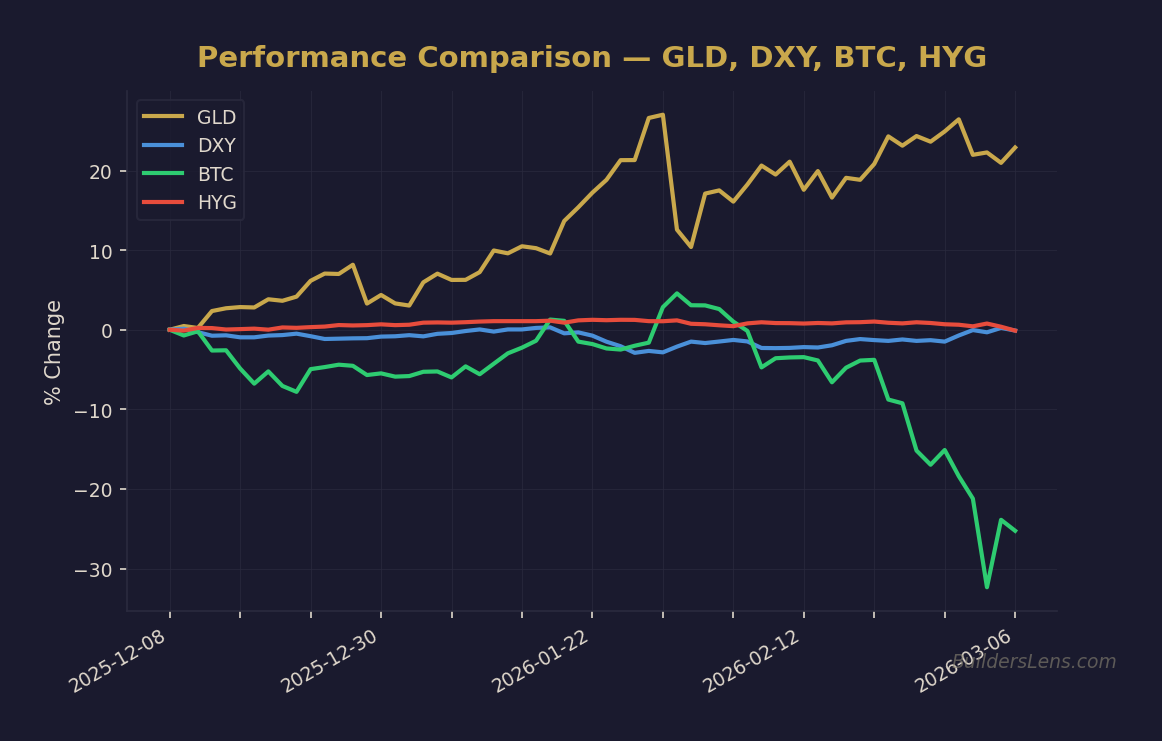
Source: BuildersLens.com Signal Framework | Data as of March 08, 2026
The claim is structural rather than directional. Liquidity still exists, but it is
no longer reliably cushioning every pullback.
Signal Classification Within Our Strategy
- Liquidity plumbing: Irregular delivery of policy support
- Risk appetite: Preference for cash over forced rotation
- Market structure: Reduced shock absorption capacity
This is a delivery signal, not a liquidity withdrawal signal.
The Mechanism: Why “Lumpy” Liquidity Matters
In a smooth liquidity regime, capital flows continuously. Pullbacks are shallow,
rebounds are quick, and volatility remains suppressed. Late in cycles, that regime
often changes.
Liquidity still arrives—but unevenly:
- Policy support becomes episodic rather than persistent
- Capital waits for confirmation instead of front-running intervention
- Markets experience air pockets between liquidity events
This environment does not require recession or crisis. It simply increases downside
asymmetry and raises the cost of complacent positioning.
Phase Mapping: Where This Fits in the Cycle
Within Our Strategy framework, this behavior aligns with
late Phase 1: Melt-Up With Cracks.
Liquidity remains present, but its reliability is declining. That raises volatility
and air-pocket risk without confirming a Phase 2 forced-liquidity cascade.
Probability & Timeline Assessment (Non-Predictive)
-
Phase 1 continuation with rising air-pocket risk:
~60–70% probability through mid-2026. -
Transition toward Phase 2 conditions:
~20–30% probability by December 2026 if liquidity becomes increasingly reactive
rather than preventative. -
Phase 3 policy-dominant regime:
~15–25% probability by June 2027, conditional on funding or credit confirmation.
The critical variable is not liquidity quantity, but liquidity reliability.
What Changes in Our Strategy
- Greater emphasis on liquidity plumbing over macro narratives
- Tighter exit discipline during extended risk-on conditions
- Higher sensitivity to funding, yields, and policy timing
What Does Not Change
- No assumption of imminent crisis
- No abandonment of optionality or cash as strategic assets
- No reliance on single-asset or single-signal conclusions
- No front-running of forced-liquidity phases
Signals We Continue to Monitor
- Credit spreads and short-term funding stress
- Long-end yield behavior and term premium pressure
- Dollar stability and global funding conditions
- Money market fund balances
- Gold, Bitcoin, and volatility as liquidity-sensitive indicators
Invalidation Conditions
- Return to sustained, predictable liquidity delivery
- Broad risk appetite reasserting ahead of policy action
- Persistent compression in funding and credit stress metrics
Source
This article is for educational and informational purposes only. It reflects a
probability-based analytical framework and does not constitute investment advice or
recommendations.
Get the Daily Phase Brief
Signal changes, data releases to watch, and today’s regime assessment — delivered every morning before market open.
Join investors tracking the macro cycle. Unsubscribe anytime.
📊 Run Your Own Analysis
Use the BuildersLens 65-Signal Analyzer for live macro positioning:
→ Analyze HYG (High Yield Credit)