Research · Narrative Translation
Why Technical Analysis Fails Without Liquidity Context
Technical Analysis Inside a Macro Phase Framework
The core message presented in the video centers on technical analysis: price, pattern, and time. While framed as a trading education platform, the deeper structural relevance lies in how technical tools function within broader liquidity and macro regimes.
Our Strategy does not treat technical indicators as predictive devices. Instead, we treat them as positioning diagnostics. Price reflects prior capital commitment. Pattern reflects crowd psychology. Time reflects probabilistic exhaustion windows. None of these operate independently of liquidity and credit conditions.
Mechanism Over Narrative
Markets are liquidity systems before they are storytelling devices. Late-cycle conditions often produce elevated price stability while underlying fragility builds. In such environments, volatility suppression can coexist with rising leverage and narrowing breadth.
Source: BuildersLens.com Signal Framework | Data as of March 08, 2026
This aligns with Phase 1 — Melt-Up or Compression With Structural Fragility in Our Strategy framework. In this phase:
- Price trends can persist.
- Technical breakouts appear reliable.
- Liquidity deterioration may be subtle.
- Credit stress remains beneath surface levels.
The structural risk is not immediate collapse. The structural risk is misclassification of regime.
Current Phase Assessment
Based on the broader signal stack including liquidity momentum, credit spreads, labor softening, and term premium dynamics, Our Strategy assigns:
- Approximately sixty five percent probability that Phase 1 compression behavior persists into June 2026.
- Approximately twenty five percent probability of earlier transition into a forced-liquidity Phase 2 before that timeline.
- Approximately ten percent probability of extended grind higher with increasing internal fragility into December 2026.
These are probability bands, not forecasts.
Phase Sequencing Map
Phase 1 — Melt-Up or Compression
Markets remain supported by residual liquidity and positioning momentum. Technical tools function well in trending environments.
Phase 2 — Forced Liquidity Window
Triggered by widening credit spreads, funding stress, auction weakness, or volatility regime shift. Technical levels become less reliable as correlations rise.
Phase 3 — Policy Stabilization
If Phase 2 materializes, policy response likely follows. Risk assets can rebound sharply. Liquidity-sensitive instruments typically respond first.
Phase 4 — Real Asset Repricing
Structural inflation volatility or fiscal dominance would shift leadership toward tangible assets into mid-2027 scenarios.
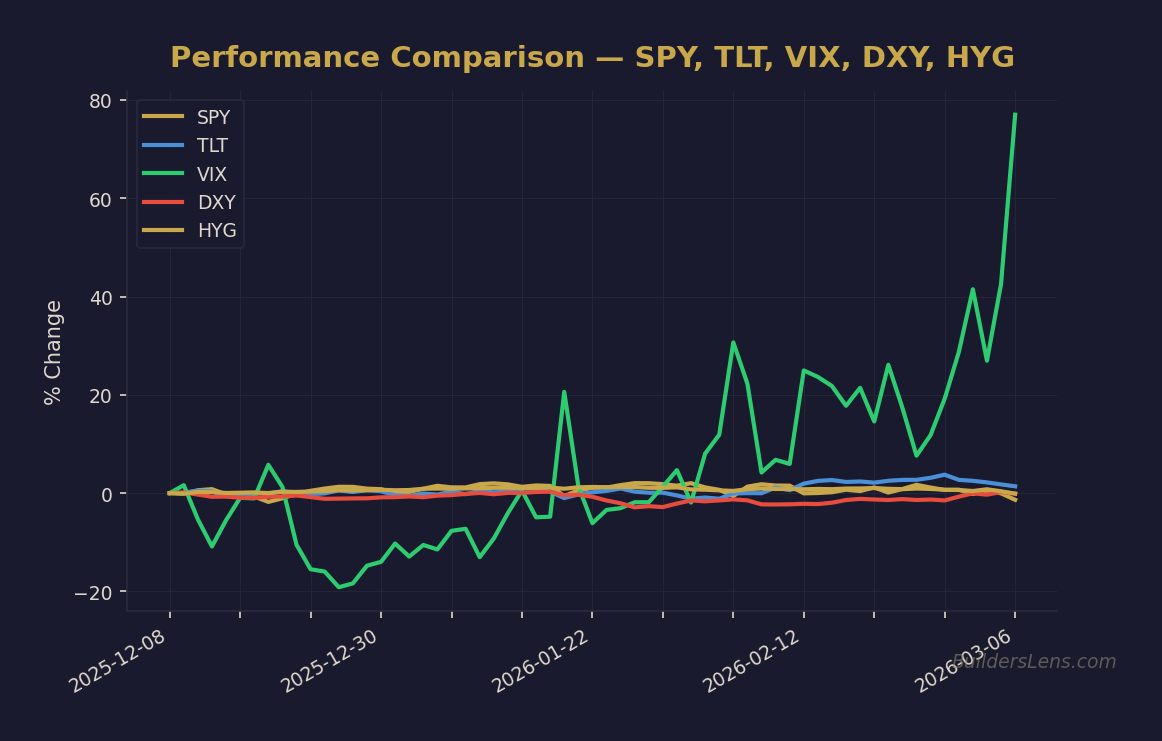
Multi-Asset Monitoring Dashboard
Key observation instruments for structural monitoring:
- SPY — Broad equity beta and breadth health
- SMH and AIQ — Concentration risk and leadership fragility
- TLT and ZROZ — Duration response and term premium shifts
- VIX — Volatility regime change
- DXY — Global funding pressure
- High Yield Credit Spreads — Credit transmission risk
Confirmation Versus Invalidation
Confirmation signals of transition:
- Sustained deterioration in equity breadth.
- Credit spread expansion.
- Volatility that rises and fails to compress.
- Long-term yields rising despite easing rhetoric.
Invalidation of deterioration thesis:
- Broadening participation across sectors.
- Stable funding markets.
- Durable liquidity expansion.
What Does Not Change
- No all-in positioning.
- Ladder deployment only in forced-liquidity windows.
- Cash treated as optionality.
- High-beta exposure sized by confirmation, not enthusiasm.
Conclusion
Technical analysis becomes durable only when embedded inside macro phase recognition. Without liquidity context, it becomes reactive. With sequencing discipline, it becomes probabilistic structure.
The objective is not prediction. It is disciplined alignment with evolving regime pressure.
Get the Daily Phase Brief
Signal changes, data releases to watch, and today’s regime assessment — delivered every morning before market open.
Join investors tracking the macro cycle. Unsubscribe anytime.
📊 Run Your Own Analysis
Use the BuildersLens 65-Signal Analyzer for live macro positioning:
This article is for educational and informational purposes only and does not constitute investment advice. Past performance is not indicative of future results. Consult with a qualified financial advisor before making investment decisions.