Research · Uncategorized
Yield Curve Inversion
Yield Curve Inversion
What It Is, Why It Matters, and Where It Fits in the Five Phases
The yield curve inversion is one of the most widely discussed signals in macro investing —
and also one of the most misunderstood.
It is often treated as a simple alarm bell for recessions or market crashes.
In reality, it is neither a forecast nor a timing tool.
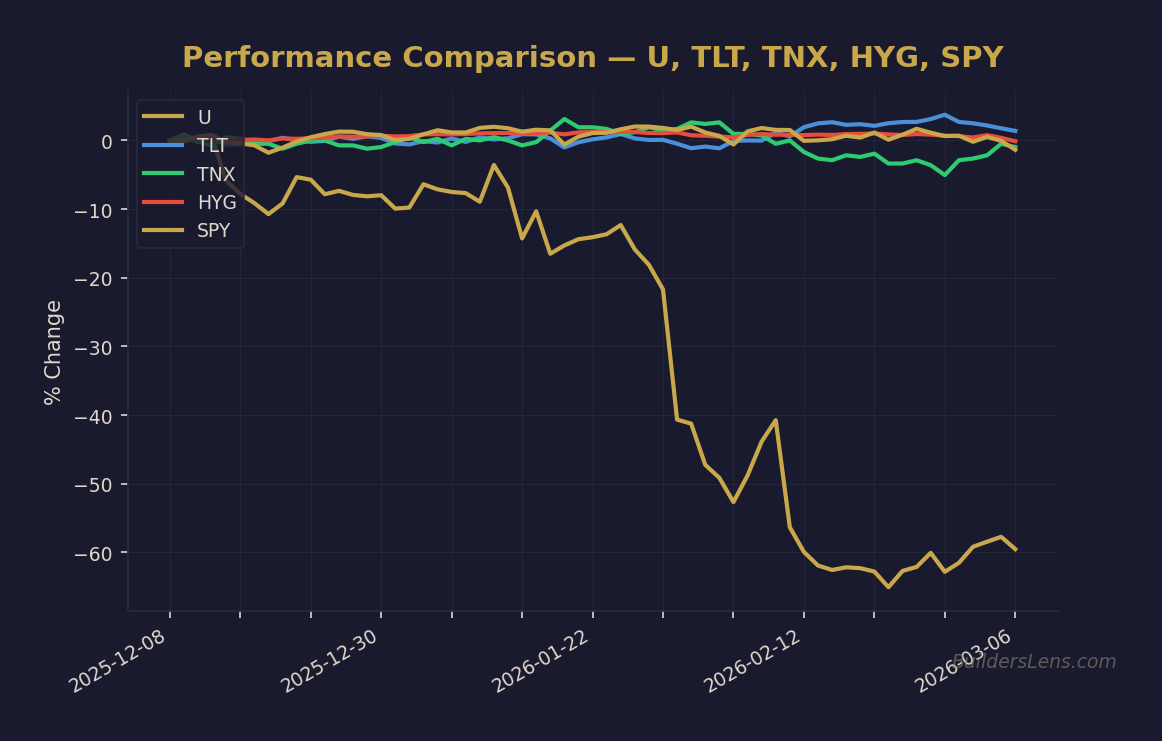
Source: BuildersLens.com Signal Framework | Data as of March 08, 2026
At BuildersLens, we use the yield curve differently.
We view it as a credit condition signal that helps identify
where we are in the macro cycle, not what will happen next.
What Is the Yield Curve? (Plain English)
The yield curve compares interest rates on short-term government debt
(such as 2-year U.S. Treasuries) to long-term government debt
(such as 10-year Treasuries).
Under normal conditions:
- Long-term rates are higher than short-term rates
- Investors demand more return for tying up money longer
This reflects confidence in growth, stability, and healthy credit conditions.
What Does It Mean When the Yield Curve Inverts?
A yield curve inversion occurs when short-term interest rates rise above long-term rates.
In simple terms:
- Short-term borrowing becomes expensive
- Long-term growth expectations weaken
- Banks’ lending incentives deteriorate
This is not primarily about fear in markets.
It is about stress in the credit system.
When banks can no longer borrow short and lend long profitably,
credit creation slows — even if asset prices are still rising.
Why the Yield Curve Has Such a Strong Reputation
Historically, yield curve inversions have preceded most U.S. recessions.
That track record is real and deserves respect.
However, this has led to a common misunderstanding:
“If the yield curve inverts, a crash is imminent.”
That conclusion is incorrect.
The yield curve does not cause recessions.
It reflects conditions where credit becomes restrictive
and the system becomes increasingly fragile.
Where Yield Curve Inversion Fits in the Five Phases
To understand the yield curve properly, it must be placed
inside a broader macro framework.
Phase 0 — Post-Crisis Expansion
In Phase 0:
- The yield curve is typically steep
- Credit conditions are improving
- Lending incentives are healthy
Yield curve inversions do not belong here.
Phase 1 — Melt-Up / Liquidity Illusion
This is where yield curve inversions most commonly appear —
and where confusion often begins.
In Phase 1:
- Asset prices are still rising
- Volatility is suppressed
- Liquidity appears abundant
Yet beneath the surface:
- Policy tightening pushes short-term rates higher
- Long-term growth expectations soften
- Credit quality quietly deteriorates
The yield curve inversion reflects this contradiction.
Markets look strong while the credit system grows uncomfortable.
This is not a failure of the signal —
it is the definition of a melt-up.
Phase 2 — Crack Formation / Rolling Stress
As the cycle transitions toward Phase 2:
- The inversion may persist
- Or begin to resolve unevenly
- Stress appears in pockets of the economy
At this point, the inversion is no longer “new information.”
Other signals — such as credit spreads and funding markets —
become more important.
Phase 3 — Forced Liquidation
By Phase 3:
- Credit has already broken
- Forced selling dominates
- The yield curve is no longer the key signal
This is why yield curve inversions are often blamed for crashes they did not cause.
They warned early — not late.
Phase 4 — Reset / Accumulation
In Phase 4:
- The yield curve typically re-steepens
- Short-term rates fall
- Long-term confidence slowly rebuilds
The inversion’s job is already complete.
Where We Are Today
Over the past several years, the U.S. experienced
one of the longest yield curve inversions in modern history.
This prolonged inversion strongly confirmed that:
- Monetary policy became restrictive
- Short-term funding costs remained elevated
- Credit conditions tightened beneath rising asset prices
In Five Phases terms:
The extended inversion validated that the system was deep in Phase 1 —
a liquidity-driven melt-up rather than a credit-healthy expansion.
As attention shifts toward the curve normalizing or re-steepening,
it is important to understand that:
- Re-steepening does not automatically mean safety
- It often reflects stress rather than growth
- The most dangerous part of the cycle often comes after inversion
What the Yield Curve Can — and Cannot — Tell Us
The yield curve is excellent at answering one question:
Are credit conditions becoming restrictive?
It cannot:
- Predict market timing
- Guarantee a recession
- Define the severity of outcomes
Under the BuildersLens framework, the yield curve is an
early warning signal, not a trigger.
Final Takeaway
Yield curve inversion is one of the most valuable macro signals —
when used correctly.
- It is not broken
- It is not predictive on its own
- It belongs primarily in late Phase 1
In the Five Phases framework, the yield curve does not tell us
what will happen next.
It tells us where we already are.
Get the Daily Phase Brief
Signal changes, data releases to watch, and today’s regime assessment — delivered every morning before market open.
Join investors tracking the macro cycle. Unsubscribe anytime.
📊 Run Your Own Analysis
Use the BuildersLens 65-Signal Analyzer for live macro positioning:
→ Analyze HYG (High Yield Credit)
This article is for educational and informational purposes only and does not constitute investment advice. Past performance is not indicative of future results. Consult with a qualified financial advisor before making investment decisions.